Why the Same Strategy Works One Day and Fails the Next
Monday: your scalping strategy crushes it — 5 trades, 4 winners. Tuesday: the same strategy, same pair, same timeframe — 5 trades, 5 losers. Nothing changed except one invisible variable: volatility.
Volatility is the market's heartbeat. When it's pumping fast, price moves farther and faster. When it's calm, price barely moves. Your strategies, position sizes, stop losses, and targets all need to adjust based on how volatile the market is right now — not yesterday, not last week, but right now.
What Is Volatility?
Volatility measures how much price moves within a given period. It's not about direction — a market can be highly volatile while going sideways (big swings in both directions) or low-volatility while trending steadily upward.
- High volatility: Big candles, wide ranges, fast moves — EUR/USD moving 120 pips in a day
- Low volatility: Small candles, tight ranges, slow price action — EUR/USD moving 30 pips in a day
Neither is inherently good or bad. But using a low-volatility strategy in high-volatility conditions (or vice versa) is like wearing flip-flops on a mountain — technically possible, but painful.
How to Measure Volatility
Tool 1: ATR (Average True Range)
The ATR tells you the average range of candles over a set period (typically 14). It's the single most useful volatility tool.
| ATR Reading (EUR/USD H4) | Condition | Adjustment |
|---|---|---|
| Below 20 pips | Low volatility | Widen targets, tighten stops, or wait |
| 20-40 pips | Normal | Standard strategy parameters |
| Above 40 pips | High volatility | Wider stops, smaller position size, bigger targets |
Pro tip: Use ATR to set your stop loss. Instead of a fixed pip amount, set your SL at 1.5x ATR. This automatically adjusts to current market conditions.
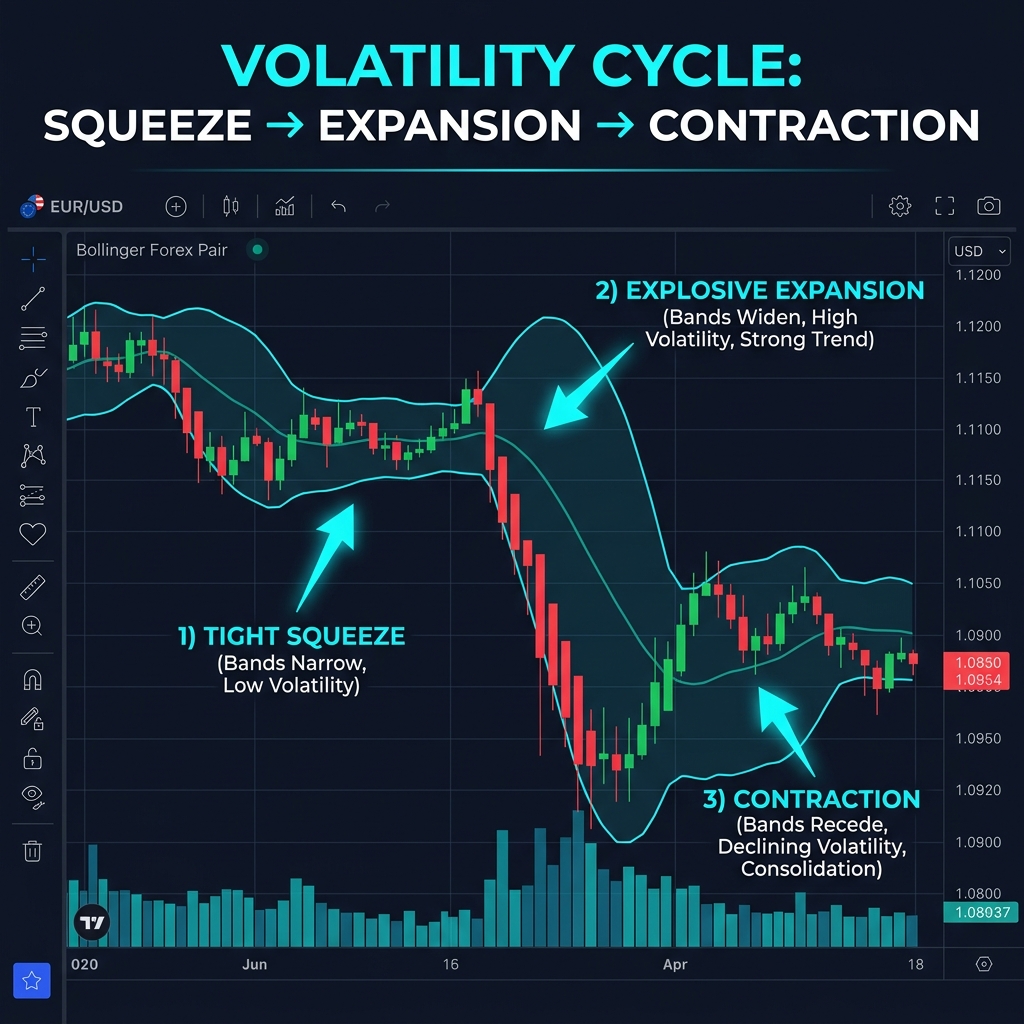
Tool 2: Bollinger Bands Width
When the bands squeeze tight, volatility is low and a big move is building. When they expand wide, volatility is high. Watch for the Bollinger Squeeze — one of the most reliable setups for catching the start of a new trend.
Tool 3: VIX (for context)
The VIX measures fear in the stock market, but it affects forex too. When VIX spikes above 25, expect increased volatility across all markets. JPY and CHF typically strengthen during high-VIX environments as safe-haven flows kick in.
How Volatility Affects Your Trading
Stop Loss Sizing
In high volatility, your normal 20-pip stop will get hit constantly — not because you're wrong, but because the market noise is wider. Your stop needs to be outside the noise.
- Low volatility: Tighter stops work (1x ATR)
- High volatility: Wider stops needed (1.5-2x ATR), but reduce position size to keep dollar risk the same
Position Sizing
If you double your stop loss distance, you must halve your position size to maintain the same dollar risk. This is non-negotiable.
Example: You normally risk $100 per trade with a 25-pip stop (0.4 lots). Today ATR is 50 pips, so your stop is 50 pips. New position size: 0.2 lots. Same $100 risk, different market conditions.
Target Setting
High volatility = bigger targets. Low volatility = smaller targets. If you keep using 50-pip targets when ATR is 20 pips, you'll rarely get filled. If you use 30-pip targets when ATR is 80 pips, you're leaving money on the table.
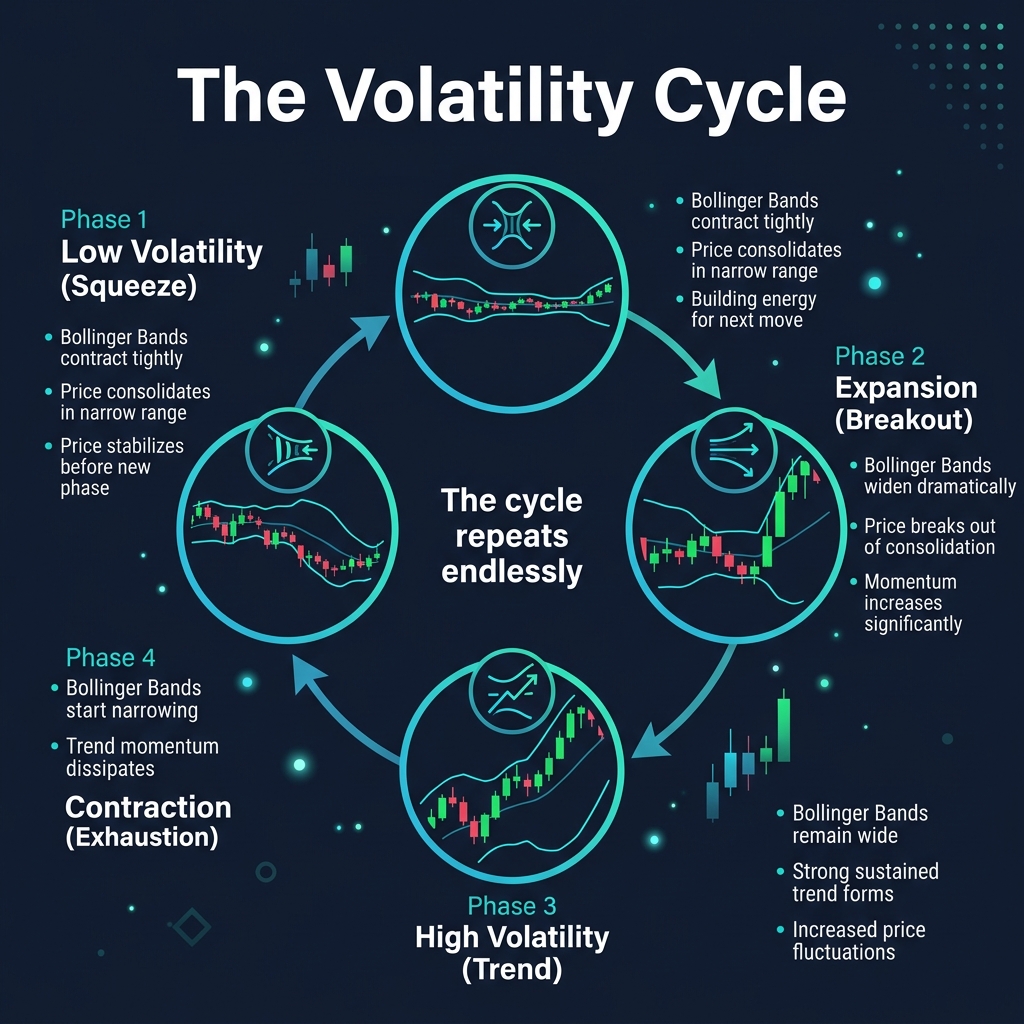
Trading the Volatility Cycle
The volatility cycle has four phases, and each favors different strategies:
| Phase | Signs | Best Strategy |
|---|---|---|
| 1. Squeeze (Low Vol) | Tight BBands, low ATR, small candles | Wait for breakout, or range trade carefully |
| 2. Expansion (Breakout) | BBands widening, ATR spiking, big candle | Breakout entry, momentum trading |
| 3. High Vol (Trend) | Wide BBands, high ATR, directional movement | Trend following, trailing stops |
| 4. Contraction (Exhaustion) | BBands narrowing, ATR declining, divergence | Take profits, prepare for range/reversal |
Session-Based Volatility
Volatility isn't constant throughout the day. It follows the trading sessions:
- Asian session (GMT 0:00-8:00): Lowest volatility. Ranges dominate. JPY pairs are most active.
- London session (GMT 8:00-16:00): Highest volatility. Most breakouts happen here. EUR and GBP pairs move the most.
- New York session (GMT 13:00-21:00): High volatility, especially during London/NY overlap (13:00-16:00 GMT). USD pairs explode.
- London/NY overlap (GMT 13:00-16:00): The most volatile 3 hours of the day. This is where the real money moves.
Quick Recap
- Volatility measures how much price moves, not which direction
- Use ATR to measure current volatility and adjust your stops, targets, and position sizes
- High volatility needs wider stops + smaller positions. Low volatility needs tighter stops + can use larger positions
- The volatility cycle: Squeeze → Expansion → Trend → Contraction
- London/NY overlap is the most volatile period — this is where most opportunities live
🎯 Your Action Step
Add the ATR (14) indicator to your EUR/USD H4 chart. Note today's ATR value. Now calculate: if your normal stop loss is 30 pips and you normally trade 0.3 lots, what position size would you use if ATR is currently 60 pips (double your normal)? Write down your adjusted position size. This quick math exercise builds the habit of adapting to volatility.