Support and Resistance That Moves With Price
In Level 4, you learned about static support and resistance — horizontal lines at fixed prices. But what if your support and resistance levels updated automatically based on the latest market data?
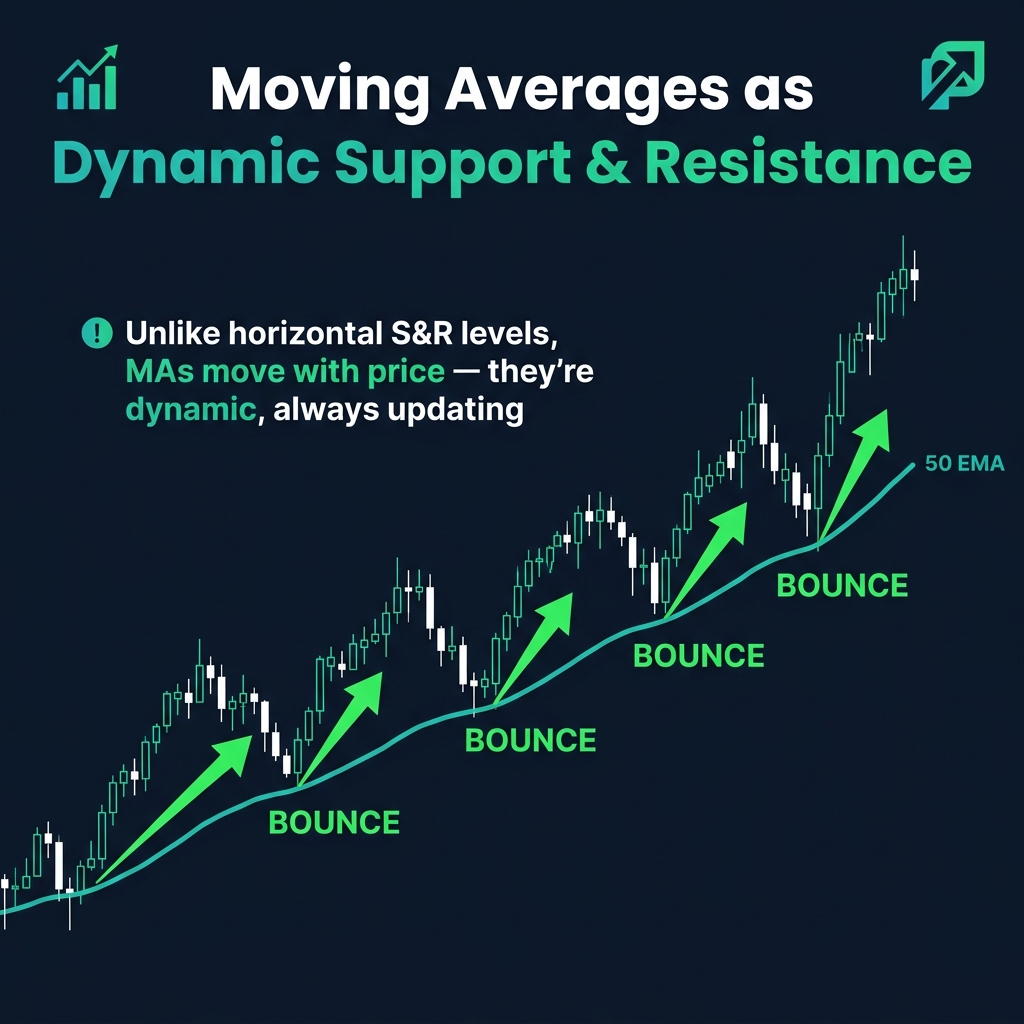
That's exactly what moving averages do. When used as dynamic support and resistance, they act as moving floors (in an uptrend) and moving ceilings (in a downtrend). Price bounces off them just like horizontal S&R — except they adapt to the market in real time.
How Moving Averages Act as Dynamic S&R
The concept is straightforward:
- In an uptrend, the moving average acts as dynamic support — price dips down to the MA and bounces back up
- In a downtrend, the moving average acts as dynamic resistance — price rallies up to the MA and gets rejected back down
The most commonly watched MAs for dynamic S&R:
| Moving Average | Role | How Traders Use It |
|---|---|---|
| 20 EMA | Fast dynamic S&R | Shallow pullback entries in strong trends |
| 50 EMA/SMA | Medium dynamic S&R | Standard pullback entries, swing trading |
| 200 SMA | Major dynamic S&R | Institutional-grade level — "the line in the sand" |
🧠 Why this works: Thousands of traders watch the same moving averages. When price touches a widely-watched MA, many traders simultaneously place trades — creating a self-fulfilling wall of buy or sell orders.
The MA Zone Strategy
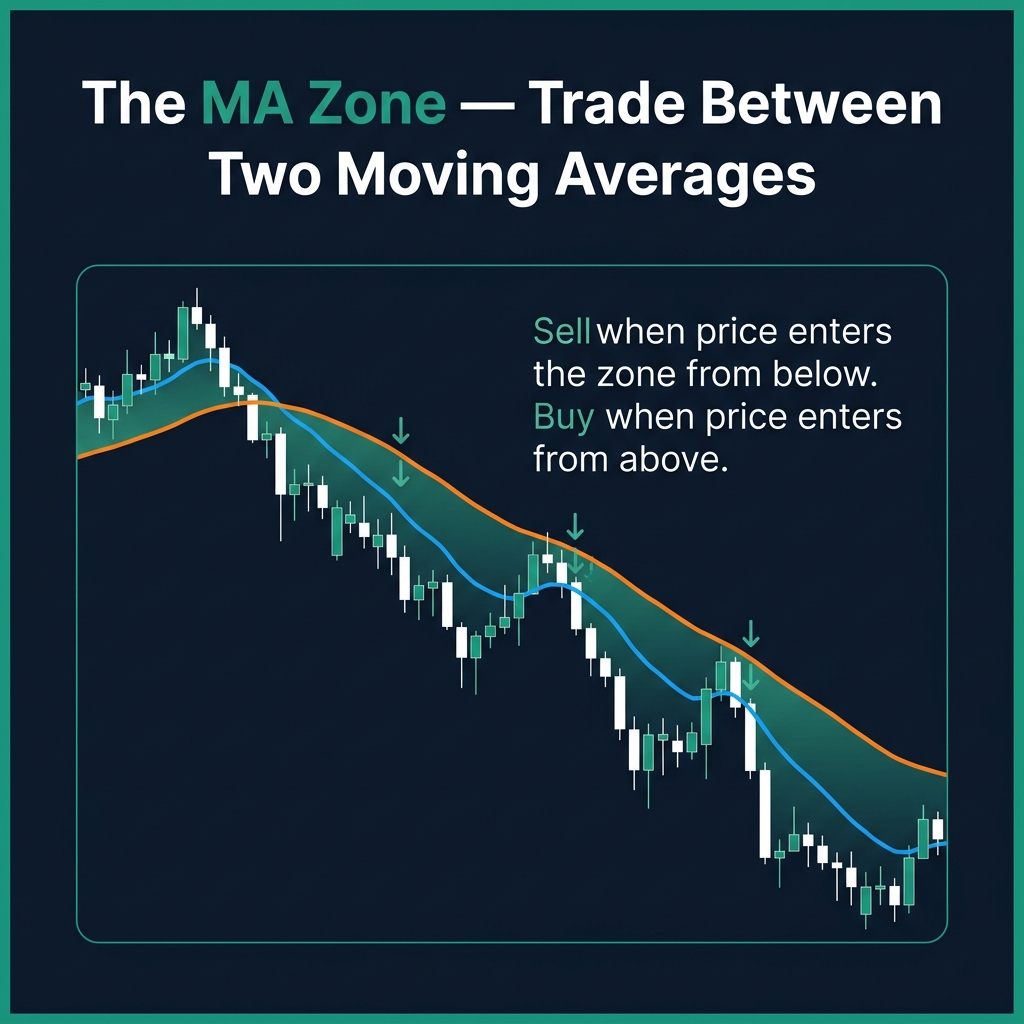
Price doesn't always bounce perfectly off a single MA line. That's why many traders use two MAs together and treat the space between them as a zone.
How it works:
- Plot the 10 EMA and 20 EMA on your chart
- The area between them is your "dynamic S&R zone"
- In an uptrend: buy when price dips into the zone and a bullish candle confirms
- In a downtrend: sell when price rallies into the zone and a bearish candle confirms
💡 Think of it as zones, not lines: Just like you learned that S&R should be drawn as zones (not exact lines), moving averages work the same way. The area between two MAs creates a more realistic reaction zone.
When Dynamic S&R Breaks
Like any support or resistance, moving averages can be broken. And when they break, the same polarity principle applies:
- MA that was support → becomes resistance (after a break below)
- MA that was resistance → becomes support (after a break above)
This is called a role reversal, and it provides excellent trade opportunities:
- Wait for the MA to break
- Wait for price to retest the broken MA from the other side
- Look for a candlestick rejection signal at the retest
- Enter in the new direction
Best Practices
- ✅ Only trade dynamic S&R in trending markets — in sideways markets, MAs flatten out and become useless
- ✅ Combine with candlestick patterns — don't buy just because price touches the MA
- ✅ Higher timeframes = stronger dynamic S&R — the Daily 200 SMA is far more powerful than the M5 200 SMA
- ✅ Leave MAs on your chart permanently — they automatically update, no re-drawing needed
Quick Recap
- ✅ Moving averages act as dynamic support (uptrend) and resistance (downtrend)
- ✅ Most-watched levels: 20 EMA, 50 EMA/SMA, 200 SMA
- ✅ Use two MAs together (10 + 20 EMA) to create a dynamic S&R zone
- ✅ When an MA breaks, watch for role reversal — support becomes resistance and vice versa
- ✅ Always confirm with candlestick patterns — don't trade the MA touch alone
🎯 Your Action Step
On GBP/USD H4 chart, add the 50 EMA. Find 3 instances in the last 2 months where price pulled back to the 50 EMA and bounced. Was there a candlestick rejection (hammer, engulfing) at the MA? This trains you to spot dynamic S&R opportunities in real time.
Module 2 complete! → Take the Moving Averages quiz to test your knowledge and earn your Trend-Following certificate.