The Coiled Spring
Imagine a spring being compressed tighter and tighter. Eventually, it has to release — and when it does, it moves fast. That's exactly what triangle patterns represent on a chart: price being squeezed into a tighter range until it explodes in one direction.
Triangles are continuation patterns, meaning they usually resolve in the direction of the prior trend. Learn to spot them, and you'll catch powerful moves right at the breakout.
The Three Types
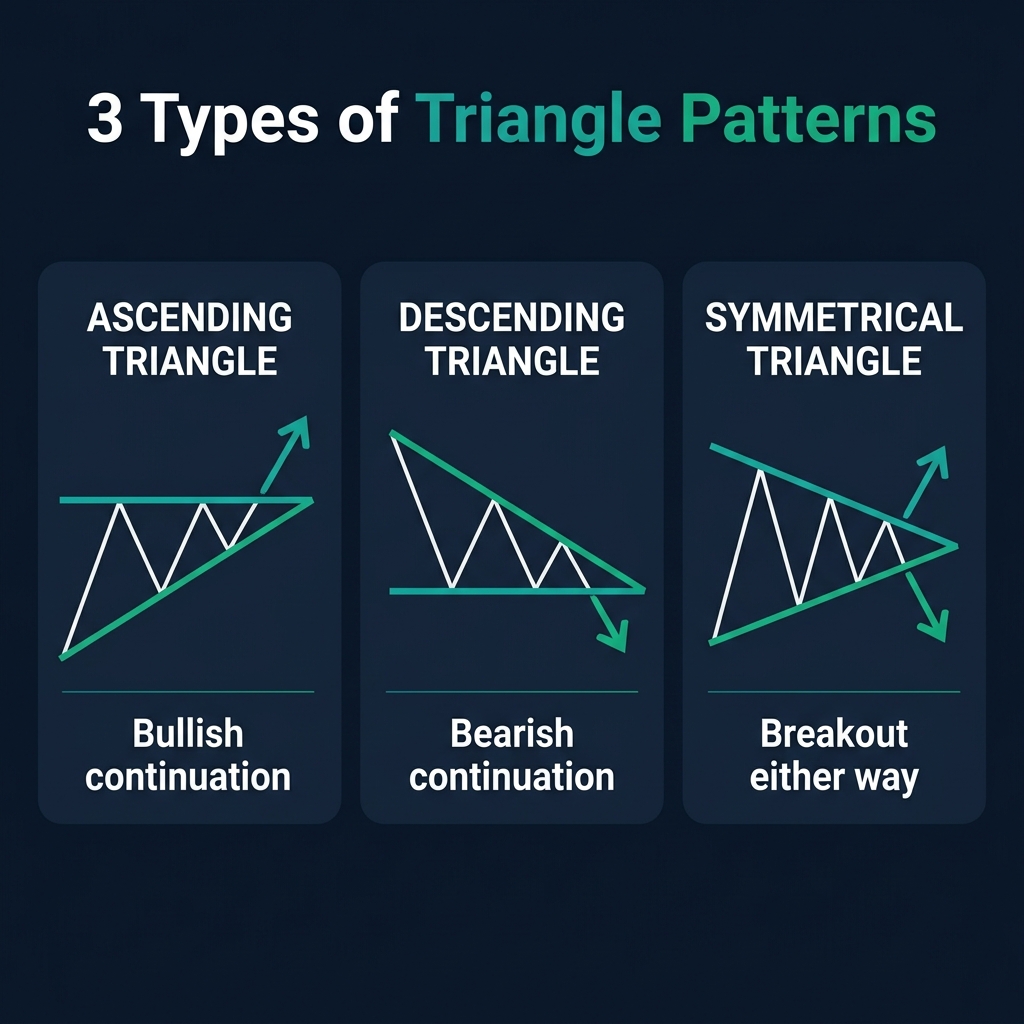
1. Ascending Triangle — Bullish Bias
The ascending triangle has a flat resistance line on top and a rising support line below. Each time price bounces, the lows get higher — telling you that buyers are getting more aggressive.
- Meaning: Buyers are willing to pay higher prices. They keep pushing up, testing the same resistance
- Typical breakout: Upward, through the resistance line
- Best context: Forms within an existing uptrend → continuation
2. Descending Triangle — Bearish Bias
The descending triangle has a flat support line on the bottom and a falling resistance line above. Each rally gets weaker — sellers are getting more aggressive.
- Meaning: Sellers are pressing down. Each bounce is weaker than the last
- Typical breakout: Downward, through the support line
- Best context: Forms within a downtrend → continuation
3. Symmetrical Triangle — Neutral (Breakout Either Way)
The symmetrical triangle has converging trendlines — lower highs AND higher lows. Neither side is winning.
- Meaning: Market is completely undecided — a coin toss until breakout
- Typical breakout: In the direction of the prior trend (but not always)
- Strategy: Place orders on BOTH sides and ride whichever way it breaks
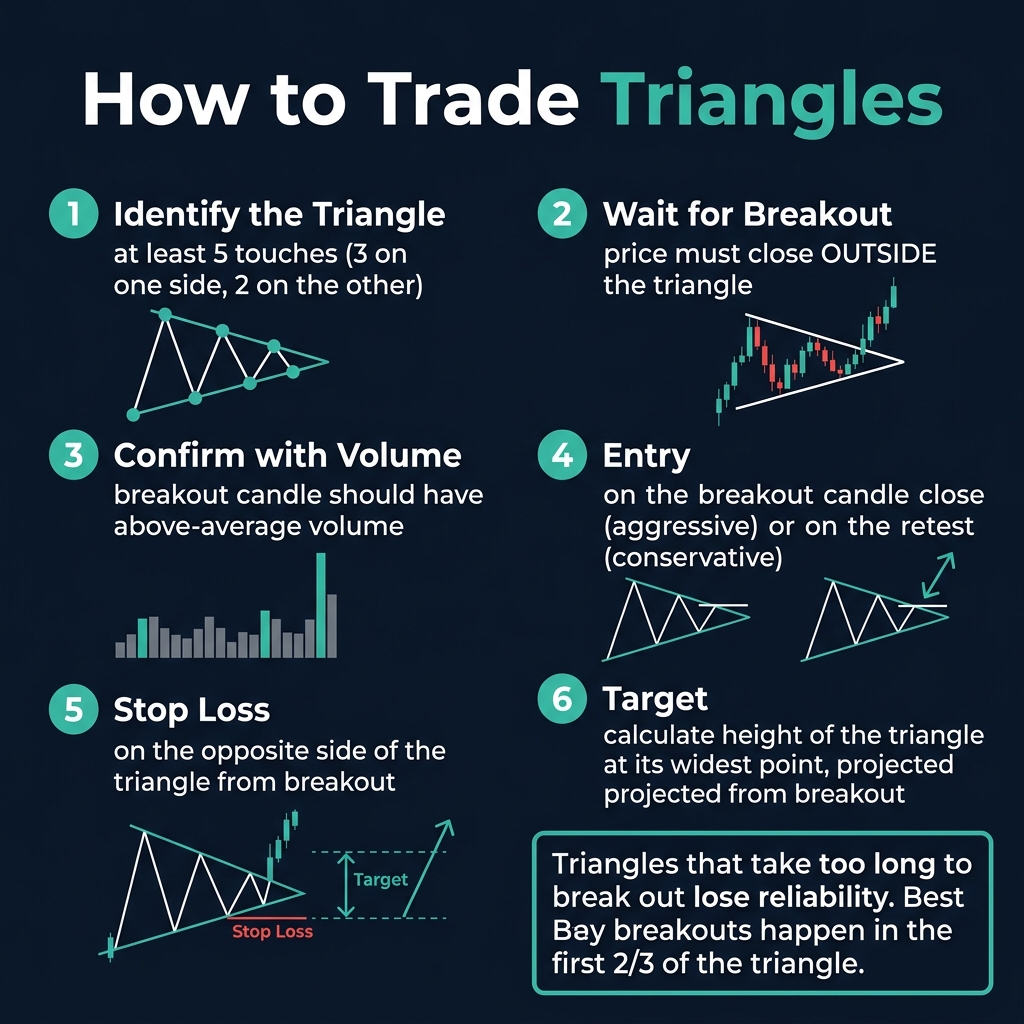
💡 The "5-touch rule": A triangle needs at least 5 touches of support/resistance (e.g., 3 touches on one line, 2 on the other) to be considered a valid pattern.
How to Trade Triangles
The Entry
- Aggressive: Enter when a candle closes outside the triangle boundary
- Conservative: Wait for the breakout candle + the next candle to confirm the direction
- For symmetrical triangles, you can place two pending orders — one above resistance, one below support. Whichever triggers first, cancel the other
Stop Loss
- Place your stop on the opposite side of the triangle from the breakout
- Ascending triangle breakout up → stop below the last significant low inside the triangle
- Descending triangle breakout down → stop above the last significant high inside the triangle
Profit Target
Measure the height of the triangle at its widest point (the base). Project that distance from the breakout point. This is your measured move target.
The Timing Secret
Not all breakouts are created equal. The best triangle breakouts happen in the first ⅔ of the pattern — when there's still energy. If price drifts all the way to the apex (the point where the lines meet), the breakout loses its power and is more likely to be a fakeout.
| Breakout Timing | Reliability |
|---|---|
| First ⅔ of triangle | ✅ High — strong momentum |
| Near the apex | ❌ Low — market exhausted, more fakeouts |
Common Mistakes
| Mistake | Fix |
|---|---|
| Trading before breakout | Wait for a close outside the triangle — wicks don't count |
| Assuming ascending always goes up | They usually do, but failed patterns happen — always set a stop |
| Ignoring volume | Ideal: decreasing volume during formation, spike on breakout |
| Trading apex breakouts | If price reaches the apex, skip it — energy is gone |
Quick Recap
- ✅ Ascending Triangle: Flat resistance + rising support → bullish breakout expected
- ✅ Descending Triangle: Flat support + falling resistance → bearish breakout expected
- ✅ Symmetrical Triangle: Converging lines → breakout either way
- ✅ 5-touch minimum for a valid triangle
- ✅ Target = height of triangle's widest point projected from breakout
- ✅ Best breakouts in the first ⅔ of the pattern — skip apex breakouts
🎯 Your Action Step
Open any major forex pair on the H4 chart and find one example of each triangle type in the past 6 months. For each one, draw the trendlines, mark where the breakout happened, and measure if the target (triangle height) was achieved. This visual practice builds the pattern recognition muscle.