The Most Expensive Mistake in Trading
You have a perfect trend-following strategy. It works beautifully when EUR/USD is making clean higher highs. But today, the market is chopping sideways — and your trend strategy just generated 4 losing trades in a row. You didn't do anything wrong technically. You simply applied the right strategy in the wrong market condition.
This single mistake — not identifying whether the market is trending or ranging — is responsible for more losses than bad entries or wrong stop-loss placement combined. Fix this first, and everything else becomes easier.
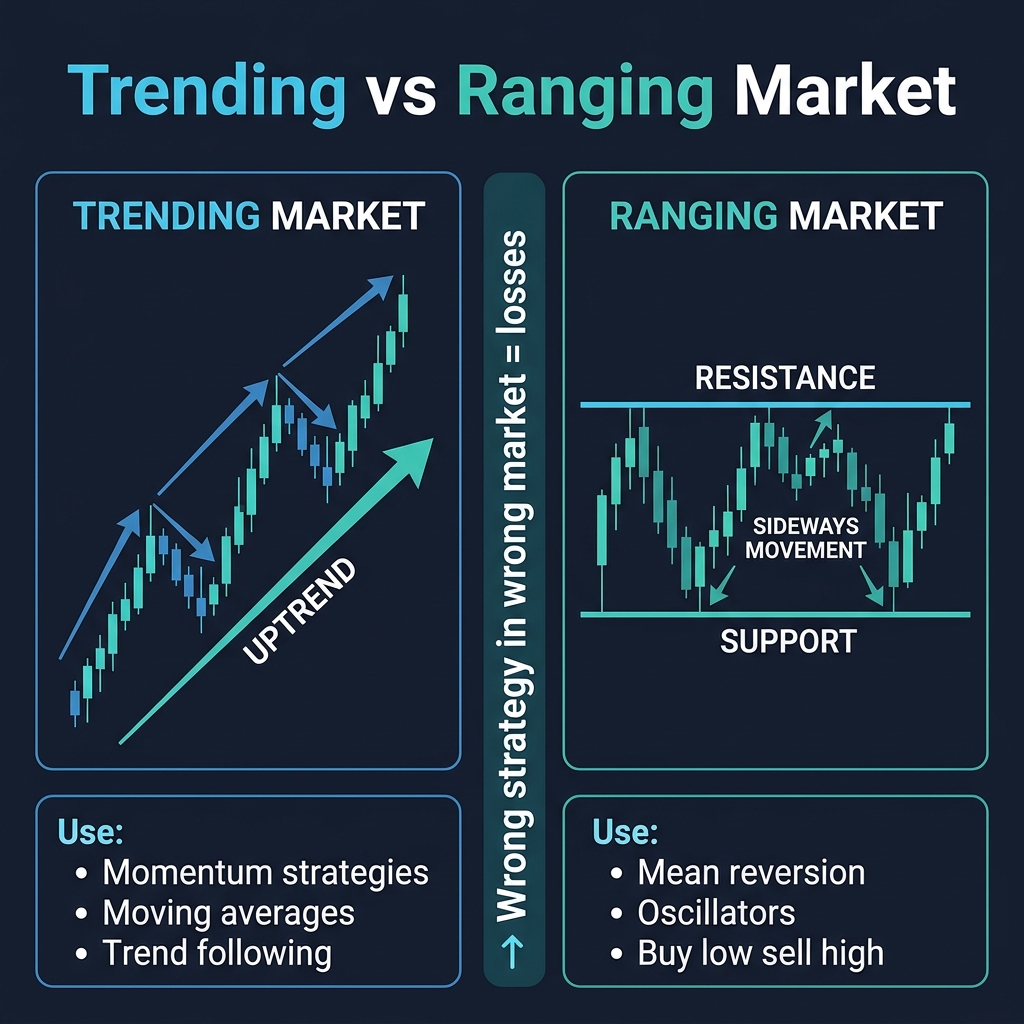
What a Trending Market Looks Like
A trending market has directional momentum. Price is consistently moving in one direction, creating structure:
- Uptrend: Higher highs (HH) and higher lows (HL) — each peak and each dip is above the previous one
- Downtrend: Lower highs (LH) and lower lows (LL) — each peak and each dip is below the previous one
In a trending market, momentum strategies win: trend following, moving average crossovers, breakouts, and hidden divergence (from Module 1). Pullbacks are buying/selling opportunities, not reversal signals.
Real example: USD/JPY from January to March 2025 moved from 148.00 to 158.00, creating a textbook uptrend. Every pullback to the 20 EMA was a buy opportunity. Traders who bought pullbacks made consistent profits. Traders who tried to short "because it's too high" got destroyed.
What a Ranging Market Looks Like
A ranging market has no clear direction. Price bounces between a ceiling (resistance) and a floor (support), like a ping-pong ball trapped in a box.
Signs of a range:
- Price keeps returning to the same levels
- Moving averages flatten out and price crosses them frequently
- Equal highs and equal lows (no HH/HL or LH/LL pattern)
In a ranging market, mean reversion strategies win: buy at support, sell at resistance, use oscillators (RSI overbought/oversold), and regular divergence. Breakout attempts usually fail.
Real example: GBP/USD from mid-February to mid-March 2025 was stuck between 1.2600 and 1.2700. Traders who bought at 1.2600 and sold at 1.2700 made money every time. Traders who tried to catch a breakout got faked out repeatedly.
4 Tools to Identify Market Conditions
Don't guess. Use these tools to objectively determine what the market is doing:
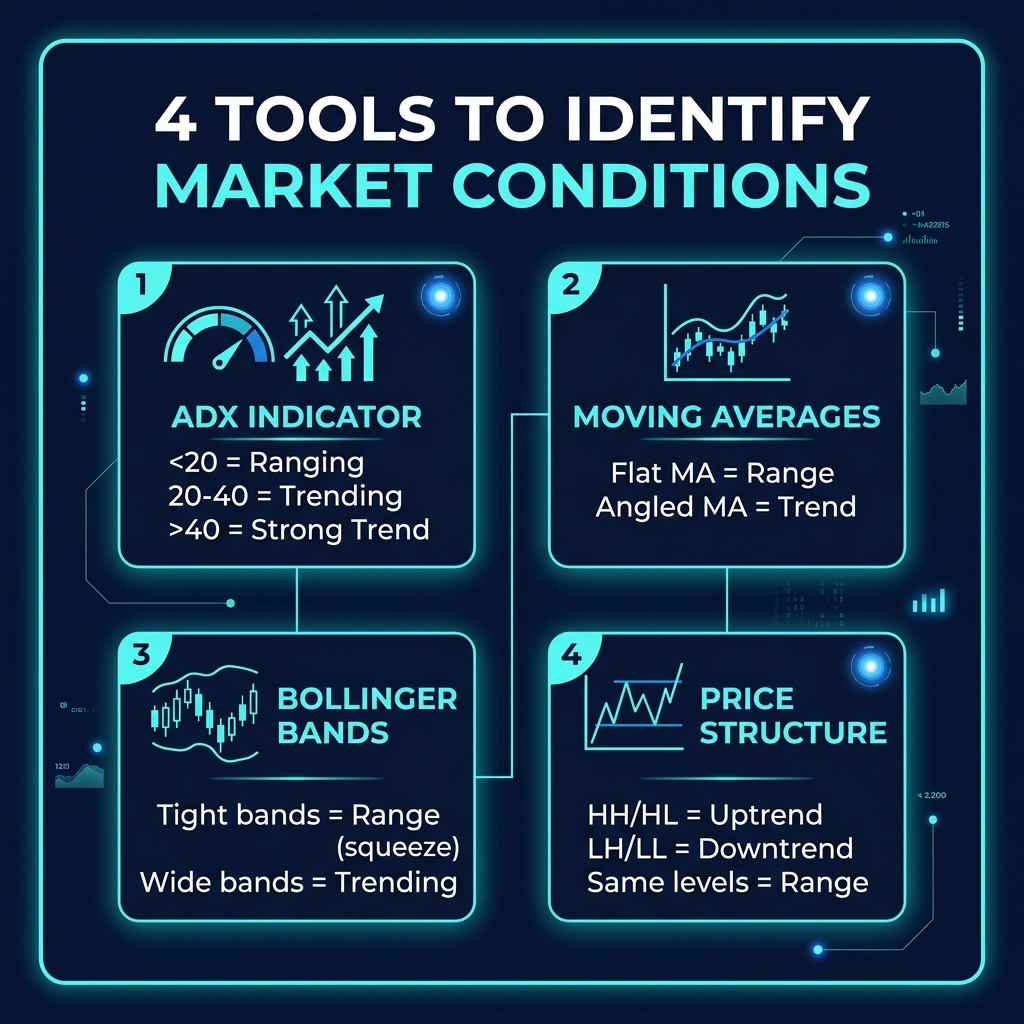
Tool 1: ADX (Average Directional Index)
The ADX is specifically designed to measure trend strength. It doesn't tell you direction — just whether the market is trending or not.
| ADX Value | Market Condition | Strategy |
|---|---|---|
| Below 20 | Ranging / No trend | Use range strategies (buy support, sell resistance) |
| 20 - 40 | Trending | Use trend-following strategies |
| Above 40 | Strong trend | Aggressive trend following, avoid counter-trend |
Tool 2: Moving Average Slope
Look at the 50 EMA. If it's flat (horizontal), the market is ranging. If it's angled (sloping up or down clearly), the market is trending. Simple but effective.
Tool 3: Bollinger Bands Width
Tight bands (squeeze) = ranging market, low volatility. Wide bands = trending market, high volatility. When bands squeeze tight for an extended period, a breakout is often coming — but you don't know which direction yet.
Tool 4: Price Structure (HH/HL/LH/LL)
The most fundamental method. Just look at the swings:
- HH + HL = uptrend
- LH + LL = downtrend
- Mixed or equal levels = range
The Transition Zone — When Markets Shift
Markets don't stay in one state forever. They cycle: Range → Breakout → Trend → Exhaustion → Range. The most dangerous (and profitable) moments are during transitions.
Signs a range is about to break:
- Bollinger Band squeeze getting tighter and tighter
- Volume increasing as price approaches support/resistance
- Price testing one side of the range more frequently
Signs a trend is weakening:
- ADX declining from above 40
- Regular divergence appearing (from Module 1)
- Pullbacks getting deeper and taking longer to recover
- Volume declining on each new push
Strategy Matching — Your Decision Framework
| Market Condition | Best Strategies | Avoid |
|---|---|---|
| Strong Uptrend | Buy pullbacks, hidden bullish divergence, MA bounce entries | Short selling, range strategies |
| Strong Downtrend | Sell rallies, hidden bearish divergence, MA rejection entries | Buying dips, range strategies |
| Range | Buy at support, sell at resistance, RSI overbought/oversold | Breakout entries, trend following |
| Transition / Breakout | Wait for confirmation, reduce size, watch for false breaks | Full-size positions, aggressive entries |
Quick Recap
- The most expensive mistake is applying the wrong strategy for the current market condition
- Trending markets make HH/HL (up) or LH/LL (down) — use momentum and trend-following strategies
- Ranging markets bounce between support and resistance — use mean reversion strategies
- Use ADX, MA slope, Bollinger Bands, and price structure to identify conditions
- Markets cycle: Range → Breakout → Trend → Exhaustion → Range
- The transition zones are where the highest risk AND highest reward live
🎯 Your Action Step
Open EUR/USD on the Daily chart. Add the ADX indicator (14 period) and the 50 EMA. Look at the last 3 months and label each section as "Trending" or "Ranging" based on the ADX reading and MA slope. You should find at least 2-3 transitions. For each section, ask yourself: "Which strategy would have worked best here?" This builds your market-reading instinct.