S&R on a Slope — The Dynamic Support and Resistance
So far, you've learned about horizontal support and resistance — levels where price bounces at the same price repeatedly. But markets don't just move sideways. They trend.
When a market trends, it creates diagonal S&R — and that's where trend lines and channels come in. These are the tools that help you identify the direction of the trend, find entry points within it, and recognize when the trend is about to end.
Trend lines are arguably the most underutilized tool in trading. Learn to draw them correctly, and you'll always know which way the market wants to go.
How to Draw a Trend Line
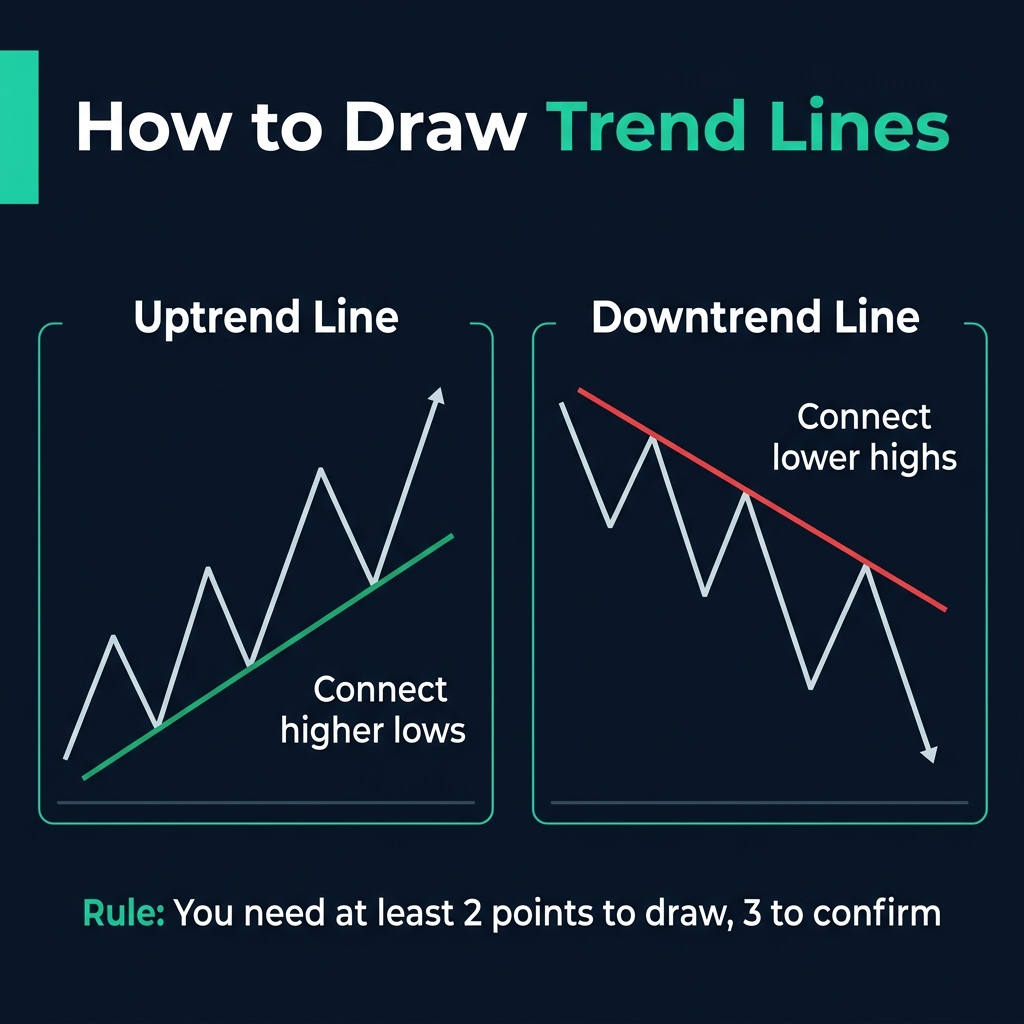
A trend line is a diagonal line drawn along the direction of the trend. The rules are simple:
Uptrend Line
- Connect two or more higher lows (the swing bottoms)
- The line acts as dynamic support — price bounces off it as it climbs
- As long as price stays above the trend line, the uptrend is intact
Downtrend Line
- Connect two or more lower highs (the swing tops)
- The line acts as dynamic resistance — price bounces off it as it falls
- As long as price stays below the trend line, the downtrend is intact
📏 The Golden Rule: You need 2 points to draw a trend line, but 3 touches to confirm it's valid. The more touches, the stronger the trend line.
Trend Line Validity Checklist
| Factor | Strong Trend Line | Weak Trend Line |
|---|---|---|
| Touches | 3 or more | Only 2 |
| Timeframe | Daily / H4 | M5 / M1 |
| Angle | ~30-45° (sustainable) | Too steep (>60°) = unsustainable |
| Spacing | Touches spread out evenly | Touches clustered together |
Price Channels — The Trend's Highway
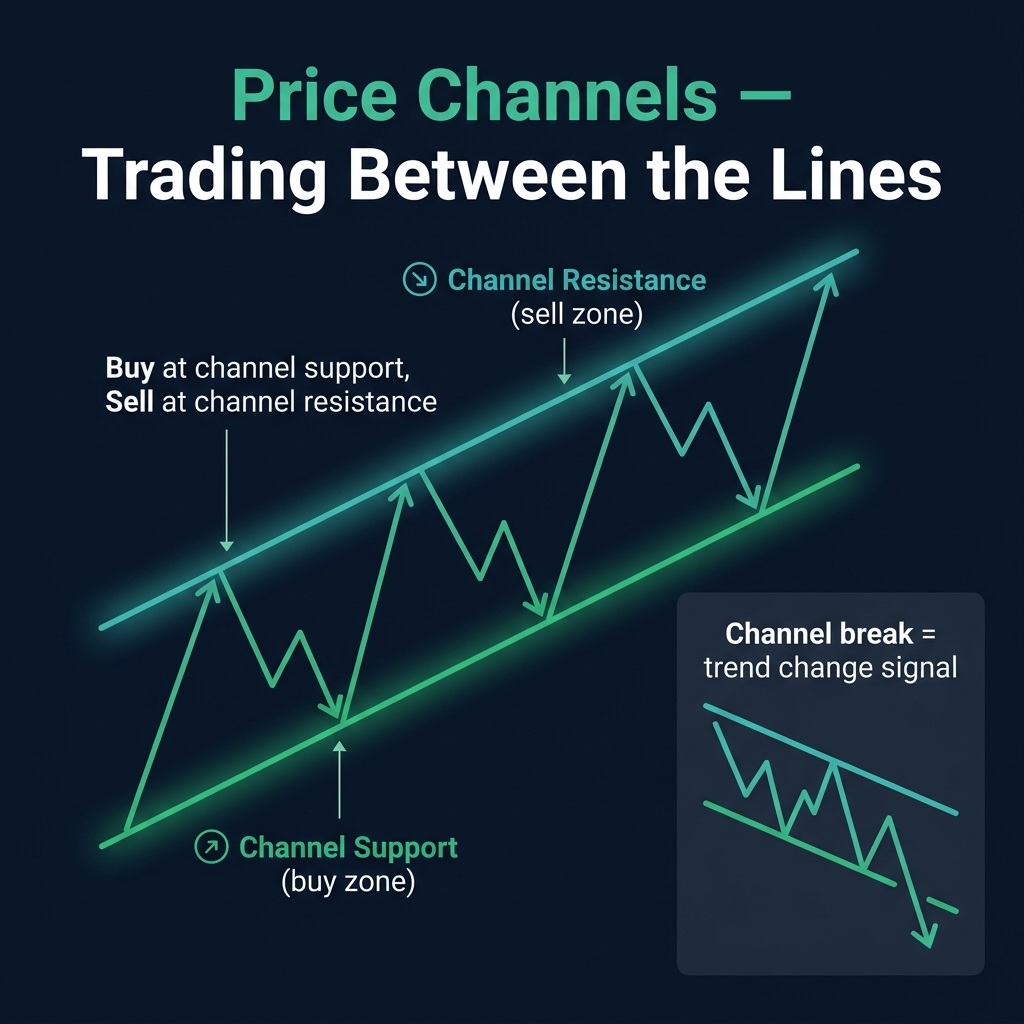
A price channel is formed by drawing a parallel line alongside your trend line. This creates a corridor that price moves within:
Ascending Channel (Uptrend)
- Lower line (channel support): Draw along the higher lows
- Upper line (channel resistance): Draw parallel through the highs
- Strategy: Buy at channel support, take profit at channel resistance
Descending Channel (Downtrend)
- Upper line (channel resistance): Draw along the lower highs
- Lower line (channel support): Draw parallel through the lows
- Strategy: Sell at channel resistance, take profit at channel support
When the Channel Breaks
A channel break is a powerful signal that the trend is either accelerating or reversing:
- Break below an ascending channel → The uptrend may be over. Look for short opportunities.
- Break above a descending channel → The downtrend may be over. Look for long opportunities.
- Break above an ascending channel → The uptrend is accelerating. But be cautious — parabolic moves often reverse sharply.
Common Trend Line Mistakes
- "Forcing the line to fit" — If you have to bend or adjust your line to touch points, it's not valid. The market draws the line — you just identify it.
- "Too steep, too fast" — Trend lines at 70-80° angles are unsustainable. The steeper the angle, the sooner the trend will break.
- "Ignoring the break" — When price closes beyond a valid trend line, respect it. Don't hope the trend will resume.
- "Drawing trend lines on every timeframe" — Stick to your trading timeframe and one timeframe higher. Too many trend lines = confusion.
Quick Recap
- ✅ Uptrend lines connect higher lows = dynamic support
- ✅ Downtrend lines connect lower highs = dynamic resistance
- ✅ 2 touches to draw, 3 touches to confirm validity
- ✅ Channels = trend line + parallel line = a trading corridor
- ✅ A channel break signals trend change or acceleration
🎯 Your Action Step
Open USD/JPY on the H4 chart. Find the most recent clear trend (either up or down). Draw a trend line connecting the swing lows (uptrend) or swing highs (downtrend). Then add a parallel line to create a channel. Can you spot where price bounced within the channel? That's your trade zone.