From Theory to Execution
You now understand what pivot points are and how they're calculated. But knowing the levels is only half the battle — the other half is knowing what to do when price arrives at those levels. This lesson gives you a complete, step-by-step trading strategy using pivot points.
Step 1: Pre-Market Preparation
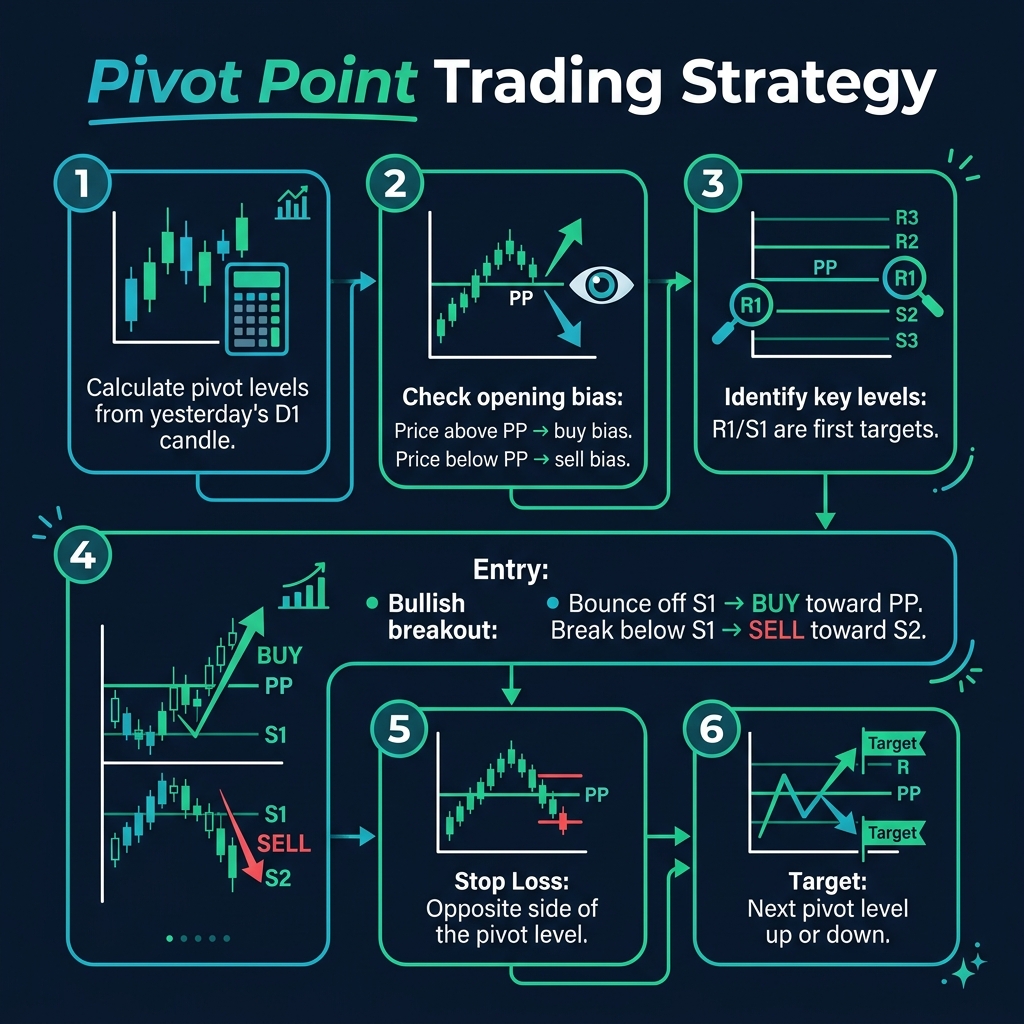
Before the market opens (or before your trading session), set up your pivot levels:
- Add the Pivot Points Standard indicator to your chart (H1 or M30 timeframe)
- Set the pivot calculation to Daily
- Note the PP, R1, R2, S1, S2 levels
- Mark any levels that align with previous support/resistance — these are the strongest levels
💡 Confluence is king: When a pivot level lines up with a previous support/resistance, a Fibonacci level, or a round number — that level becomes significantly more powerful.
Step 2: Determine the Daily Bias
At the start of the session, check where price opens relative to the PP:
| Price Location | Bias | Strategy |
|---|---|---|
| Above PP | Bullish | Look for buy setups toward R1, R2 |
| Below PP | Bearish | Look for sell setups toward S1, S2 |
| Hovering around PP | Neutral | Wait for a clear break before trading |
This simple rule prevents you from fighting the market. If price is above PP, you only look for longs. If below, only shorts.
Step 3: The Two Strategies
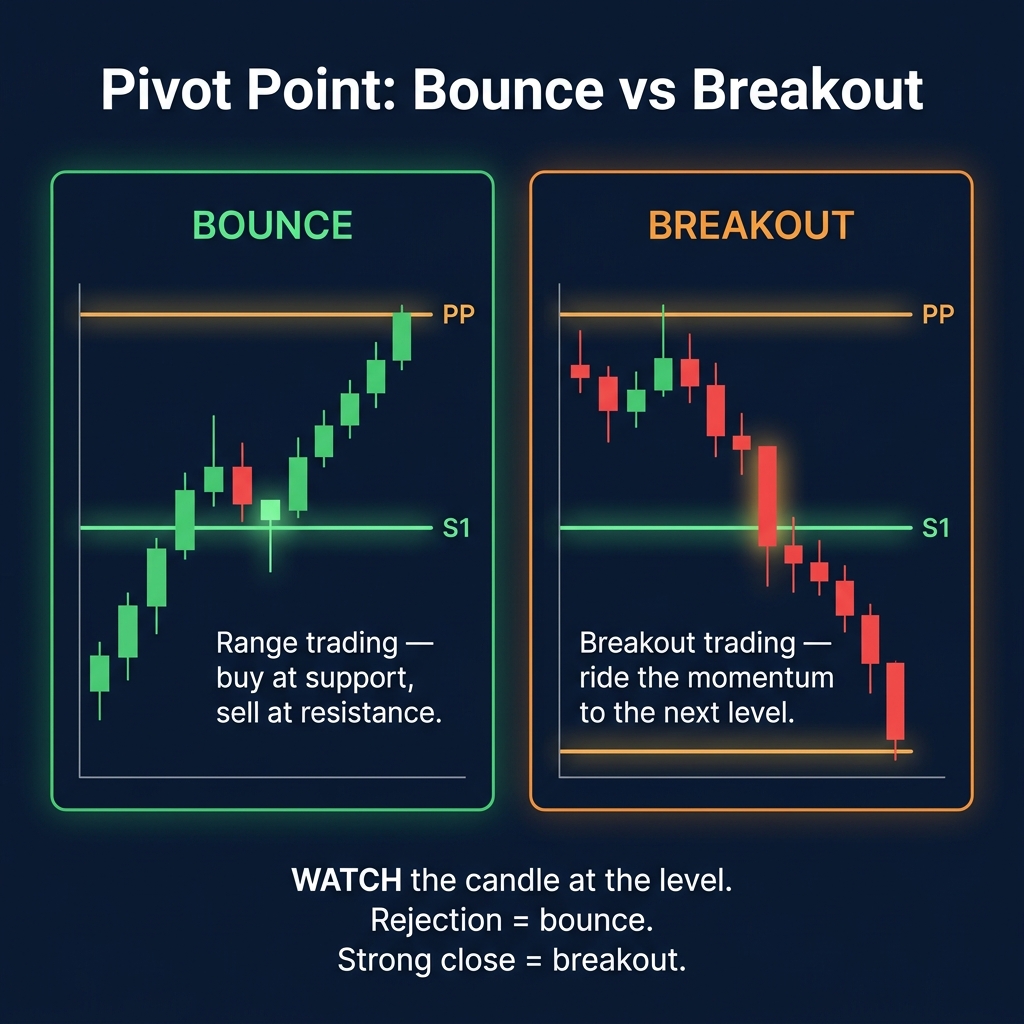
Strategy A: Pivot Bounce (Range Trading)
This strategy works on normal, range-bound days when price moves between S1 and R1:
- Wait for price to reach S1 (for a buy) or R1 (for a sell)
- Watch the candle: Look for a rejection pattern (hammer, doji, engulfing) at the pivot level
- Enter: Buy at S1 with a rejection candle, or sell at R1 with a rejection candle
- Stop: Place stop beyond S2 (for buys) or R2 (for sells)
- Target: The next pivot level in yur direction (e.g., buy at S1 → target PP or R1)
Strategy B: Pivot Breakout (Trend Trading)
This strategy works on strong trending days when price blasts through pivot levels:
- Watch for price to approach a pivot level with momentum (strong candle, no wick)
- Breakout confirmation: Price closes clearly beyond the level — not just touching it
- Enter: On the breakout close, or on the retest of the broken level
- Stop: Behind the broken level (e.g., break above R1 → stop just below R1)
- Target: The next pivot level (e.g., break R1 → target R2)
How to Know Which Strategy to Use
| Clue | Use Bounce Strategy | Use Breakout Strategy |
|---|---|---|
| ADX | Below 20 (ranging) | Above 25 (trending) |
| Candle at level | Rejection wick, doji | Strong close through, no wick |
| Volume | Normal/low | Spiking on breakout |
| News | No major events | Major news driving momentum |
Step 4: Combine with Other Tools
Pivot points are powerful alone, but combine them with other tools for even higher probability:
- RSI at pivot levels: RSI oversold at S1 = strong buy signal
- Candlestick patterns: Hammer at S1, shooting star at R1 = confirmation
- Fibonacci levels: When a 0.618 retracement lines up with a pivot level = very strong confluence
- Previous S/R: Pivot level + historical support/resistance = institutional-grade level
Step 5: Intraday Reversal Detection
One of the most powerful pivot strategies is detecting intraday reversals:
- If price extends all the way to R2 or R3, expect a pullback — consider taking profits or entering a counter-trend trade
- If price extends to S2 or S3, expect a bounce — the selloff is likely overextended
🎯 R3 and S3 are your "extreme" signals. When price reaches these levels, the daily move is usually exhausting. Smart traders take profits here, not chase momentum.
Worked Example
Let's say yesterday's EUR/USD data was:
- High: 1.0850
- Low: 1.0780
- Close: 1.0820
Calculations:
- PP = (1.0850 + 1.0780 + 1.0820) ÷ 3 = 1.0817
- R1 = (2 × 1.0817) − 1.0780 = 1.0854
- S1 = (2 × 1.0817) − 1.0850 = 1.0784
- R2 = 1.0817 + (1.0850 − 1.0780) = 1.0887
- S2 = 1.0817 − (1.0850 − 1.0780) = 1.0747
Trading plan: Today opens at 1.0825 (above PP = bullish bias). First target: R1 at 1.0854. If broken, watch R2 at 1.0887. If price pulls back to PP (1.0817) and shows a rejection candle, that's a buy entry.
Common Mistakes
| Mistake | Fix |
|---|---|
| Using daily pivots on weekly charts | Match pivot timeframe to your trading timeframe (daily pivots for day trading, weekly for swing trading) |
| Trading every level touch | Wait for confirmation (rejection candle or breakout close) |
| Ignoring confluence | The best trades are where pivots align with other S/R, Fibonacci, or round numbers |
| Using pivots in isolation | Combine with RSI, candlestick patterns, and volume for the best results |
Quick Recap
- ✅ Pre-market: Set up pivot levels and identify confluence zones
- ✅ Daily bias: Above PP = bullish, below PP = bearish
- ✅ Range days: Use bounce strategy (buy S1, sell R1)
- ✅ Trend days: Use breakout strategy (trade the break through levels)
- ✅ R3/S3 = extreme levels → expect pullback, not continuation
- ✅ Always combine with candlestick confirmation and indicator confluence
🎯 Your Action Step
Set up the Pivot Points indicator on your EUR/USD H1 chart for today's session. Before the session starts, write down your bias (is price above or below PP?) and identify which strategy you'd use at each level. Then watch how price interacts with S1, R1 in real time. This real-time observation is the fastest way to internalize pivot point trading.