You Spotted Divergence — Now What?
You know what regular divergence looks like. You know what hidden divergence looks like. But knowing how to spot divergence and knowing how to trade it are two completely different things. Most blown accounts from divergence trading happen not because the signal was wrong — but because the trader had no rules for entry, stop loss, or targets.
This lesson gives you the complete playbook. Entry rules. Stop loss placement. Target calculation. And the confluence filters that separate high-probability setups from noise.
The #1 Rule: Divergence Is Not a Trade Signal
Let's be very clear: divergence alone is never a reason to enter a trade. It's a warning system — like a yellow traffic light. It tells you to pay attention, not to slam on the gas.
The traders who consistently profit from divergence treat it as one ingredient in a recipe, not the entire meal. You need confluence — multiple factors agreeing — before you risk real money.
Your Confluence Checklist
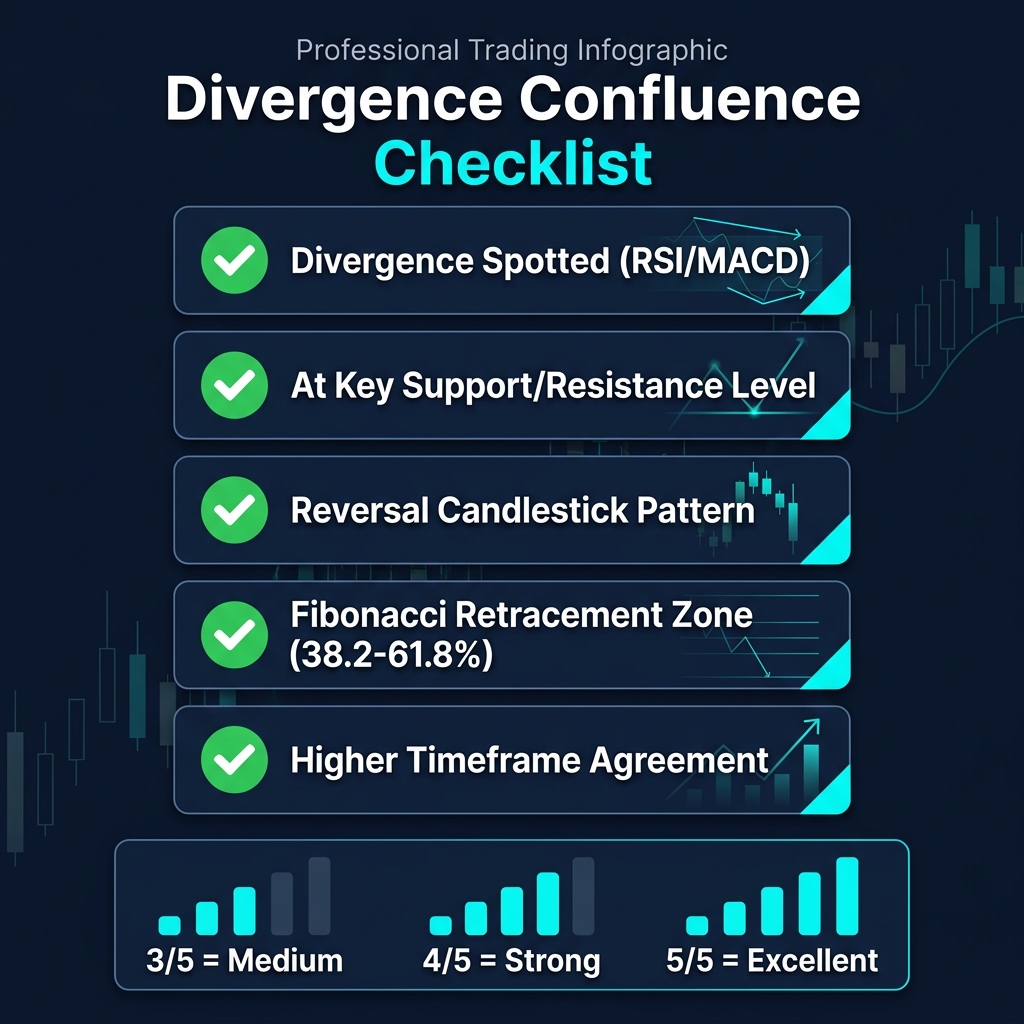
Before entering any divergence trade, check how many of these factors align:
- Divergence confirmed — RSI or MACD showing clear disagreement with price
- Key support/resistance level — Divergence at a meaningful price zone carries more weight
- Reversal candlestick pattern — Pin bar, engulfing, morning/evening star at the divergence point
- Fibonacci zone — Price at 38.2%, 50%, or 61.8% retracement level
- Higher timeframe agreement — The larger trend supports your trade direction
| Confluence Score | Signal Strength | Action |
|---|---|---|
| 1-2 factors | Weak | Skip — too risky |
| 3 factors | Medium | Trade with reduced size |
| 4 factors | Strong | Trade with normal size |
| 5 factors | Excellent | High conviction setup |
Entry Rules — Three Methods That Work
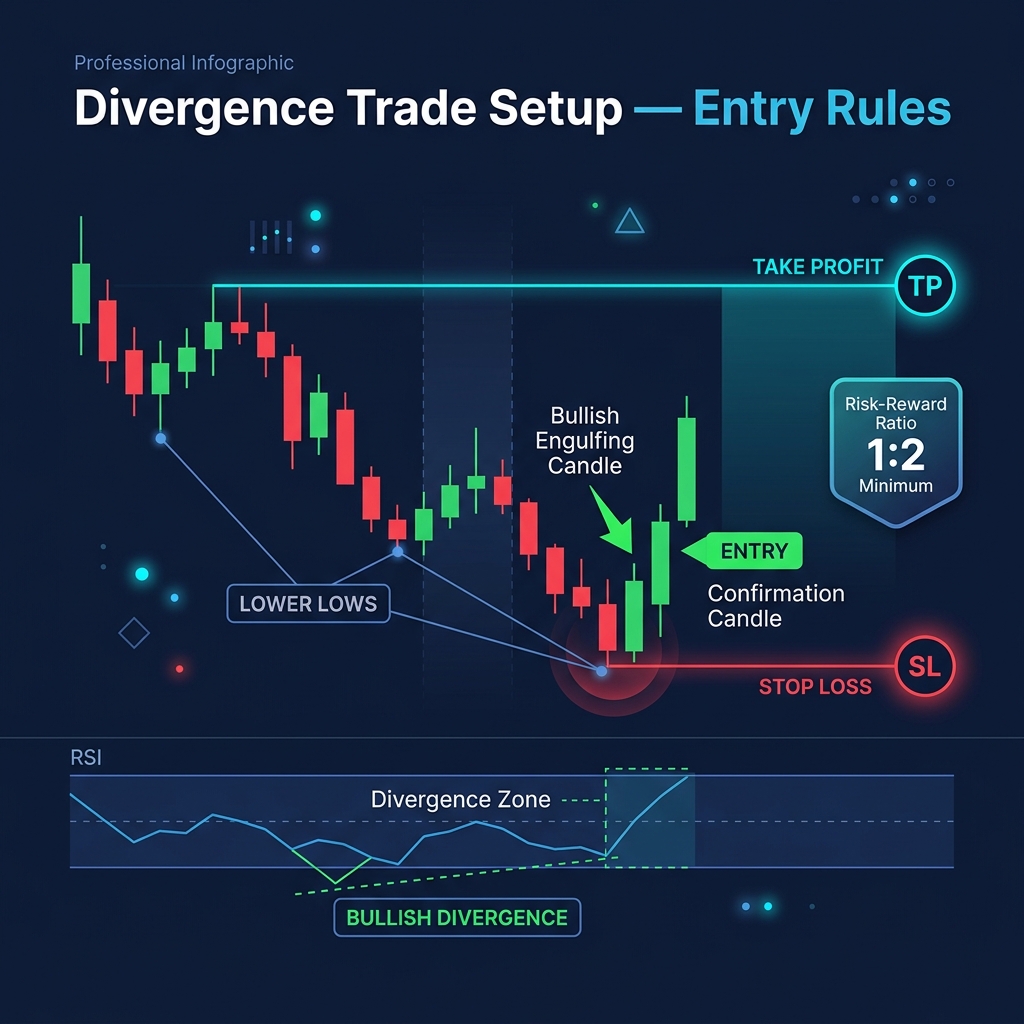
Method 1: Confirmation Candle Entry (Safest)
Wait for a reversal candlestick to form at the divergence zone, then enter after it closes.
- For bullish divergence: Wait for a bullish engulfing, hammer, or morning star
- For bearish divergence: Wait for a bearish engulfing, shooting star, or evening star
- Entry: On the open of the next candle after the confirmation candle closes
Pros: Highest probability of success. Cons: You might miss some of the move.
Method 2: Structure Break Entry (Balanced)
Wait for price to break a short-term structure level that confirms the reversal.
- For bullish divergence: Enter when price breaks above the last lower high
- For bearish divergence: Enter when price breaks below the last higher low
Pros: Strong confirmation of momentum shift. Cons: Wider stop loss needed.
Method 3: Aggressive Entry (Higher Risk, Higher Reward)
Enter at the divergence extreme with a tight stop — ideal for hidden divergence setups where the trend is confirmed.
- Enter immediately when the second leg of divergence forms
- Stop loss just beyond the divergence extreme
Pros: Best entry price, highest R:R. Cons: More likely to get stopped out.
Stop Loss Placement
Your stop loss should go where the divergence thesis is invalidated:
- Bullish divergence: Stop below the swing low that created the divergence. If price makes a new lower low AND RSI makes a new lower low too (divergence disappears), you were wrong.
- Bearish divergence: Stop above the swing high that created the divergence.
- Buffer: Add 5-10 pips beyond the swing point to avoid getting stopped by a wick
Never use a fixed pip stop. Let the chart structure determine your stop distance. If the required stop is too wide for your risk management rules, skip the trade — don't force it by shrinking the stop.
Target Setting — Three Approaches
Approach 1: Previous Structure Level
Target the last significant swing high (for longs) or swing low (for shorts). This is the most conservative and reliable approach.
Approach 2: Fixed Risk-Reward Ratio
Set your target at 2x or 3x your stop-loss distance. Simple, disciplined, and works well with divergence setups.
Approach 3: Trailing Stop
For hidden divergence (trend continuation), use a trailing stop to ride the trend. Move your stop to break-even after price moves 1x your risk, then trail behind structure.
| Divergence Type | Best Entry Method | Target Approach | Typical R:R |
|---|---|---|---|
| Regular Bullish | Confirmation candle | Previous swing high | 1:2 to 1:3 |
| Regular Bearish | Confirmation candle | Previous swing low | 1:2 to 1:3 |
| Hidden Bullish | Aggressive / at pullback | Trailing stop | 1:2 to 1:5+ |
| Hidden Bearish | Aggressive / at pullback | Trailing stop | 1:2 to 1:5+ |
Complete Trade Example — Putting It All Together
Bearish regular divergence on EUR/USD H4:
- Trend check: EUR/USD in an uptrend for 2 weeks, pushing into resistance at 1.0950
- Divergence: Price makes higher high at 1.0955, RSI makes lower high (72 → 65)
- Confluence: At major resistance (✅), RSI divergence (✅), bearish engulfing candle (✅), Fibonacci 161.8% extension zone (✅) — Score: 4/5 → Strong
- Entry: Sell at 1.0940 (after bearish engulfing closes)
- Stop loss: 1.0970 (above the swing high + 15 pip buffer) = 30 pips risk
- Target: 1.0870 (previous support) = 70 pips reward
- R:R = 1:2.3
- Result: Price drops to 1.0860 over next 3 sessions ✅
Quick Recap
- Divergence alone is not a trade signal — you need confluence (3+ factors)
- Three entry methods: confirmation candle (safest), structure break (balanced), aggressive (best R:R)
- Stop loss goes where the divergence thesis is invalidated — never use fixed pips
- Targets: use structure levels for regular divergence, trailing stops for hidden divergence
- Score your setups 1-5 on confluence — only trade 3+ scores
🎯 Your Action Step
Go back to those divergence examples you marked in the previous two lessons. Now apply the confluence checklist to each one: Was it at a key level? Was there a confirmation candle? What was the Fibonacci zone? Score each setup out of 5. Then calculate the exact entry, stop loss, and target you would have used. What R:R did you get? This exercise builds the muscle memory you'll need in live trading.