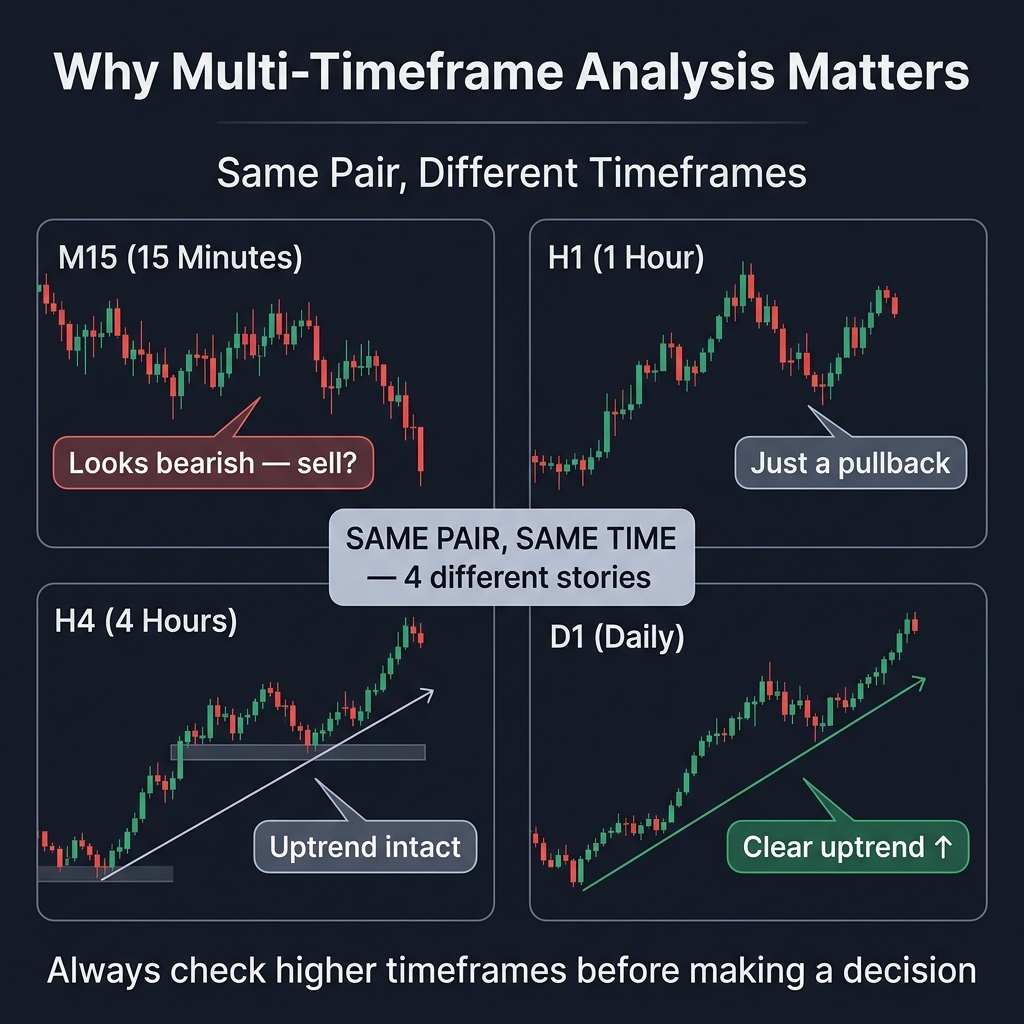
Same Chart, Completely Different Stories
Here's something that confuses every new trader: you look at EUR/USD on the 5-minute chart and it's crashing. You switch to the daily chart and it's in a strong uptrend. Which one is "right"?
Both are right. They're showing the same data — just at different zoom levels. Understanding timeframes is like understanding how a microscope works: the closer you zoom in, the more detail you see, but the less context you have.
The Timeframe Spectrum
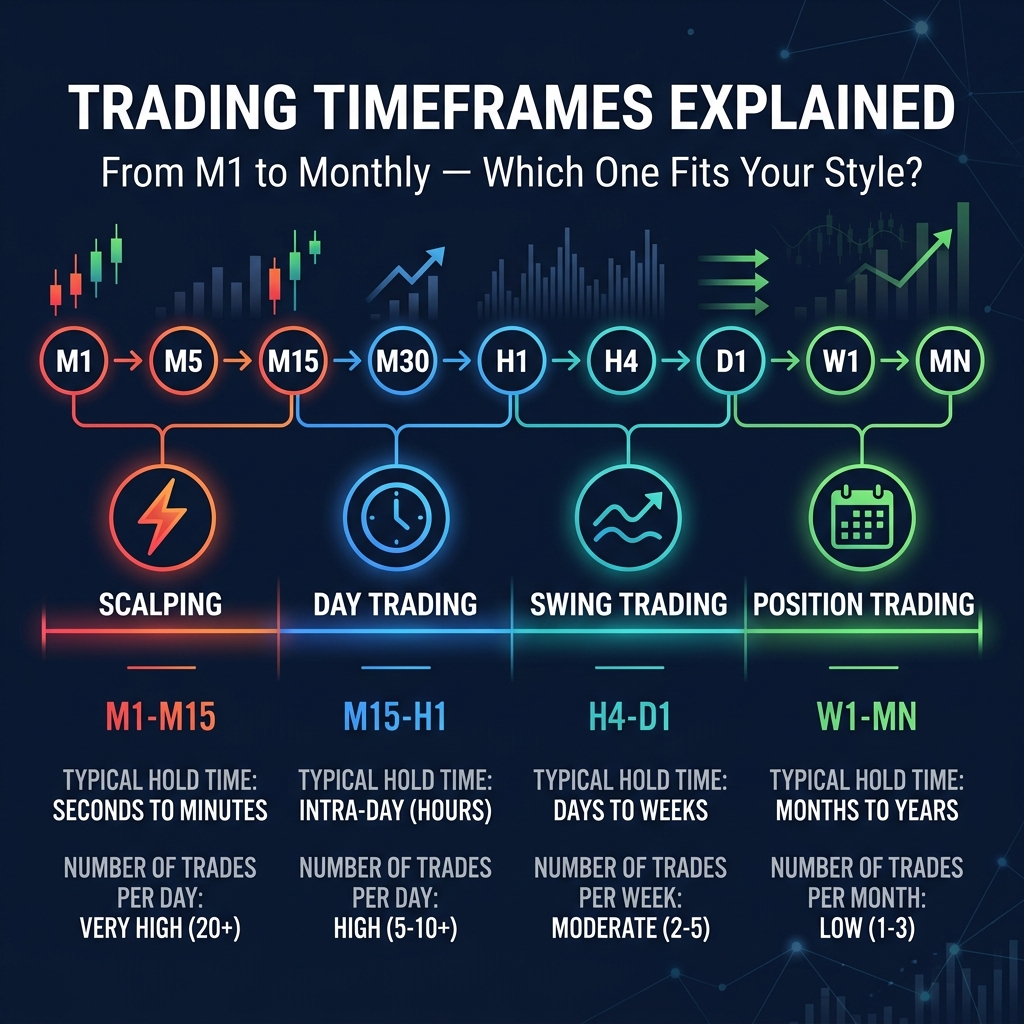
| Timeframe | Each Candle = | Trading Style | Hold Time |
|---|---|---|---|
| M1 | 1 minute | Scalping | Seconds to minutes |
| M5 | 5 minutes | Scalping / Day trading | Minutes to hours |
| M15 | 15 minutes | Day trading | Hours |
| M30 | 30 minutes | Day trading | Hours |
| H1 | 1 hour | Day / Swing trading | Hours to days |
| H4 | 4 hours | Swing trading | Days to weeks |
| D1 | 1 day | Swing / Position trading | Days to weeks |
| W1 | 1 week | Position trading | Weeks to months |
| MN | 1 month | Long-term investing | Months to years |
Which Timeframe Should YOU Use?
Scalpers (M1 - M15)
You watch charts all day, take many small trades, and aim for 5-15 pips per trade. This requires fast execution, low spreads, and constant attention. Not recommended for beginners.
Day Traders (M15 - H1)
You open and close all trades within the same day. No overnight risk. Typically 2-5 trades per day, targeting 20-50 pips. A good starting point for active beginners.
Swing Traders (H4 - D1)
You hold trades for several days to weeks, checking charts 2-3 times per day. Targeting 50-200 pips per trade. Best for people with a day job — you don't need to watch charts all day.
Position Traders (W1 - MN)
You hold trades for weeks to months based on long-term fundamental views. Very few trades per month. This requires patience and a larger account to handle wider stop losses.
The Multi-Timeframe Secret
Professional traders don't use just one timeframe. They use top-down analysis:
- Higher timeframe (D1 or W1) → Identify the overall trend direction
- Middle timeframe (H4) → Find the trading opportunity
- Lower timeframe (H1 or M15) → Precise entry point
🎯 Rule of thumb: Your analysis timeframe should be roughly 4-6x your entry timeframe. Day trader on H1? Check D1/H4 for direction. Swing trader on D1? Check W1 for context.
Common Beginner Mistakes with Timeframes
- Jumping between timeframes during a trade → You'll always find a reason to exit early or hold too long
- Using too many timeframes → You get conflicting signals and analysis paralysis
- Scalping on M1 as a beginner → Too fast, too stressful, spread costs eat your profits
Start with H1 or H4. These are the most forgiving timeframes for beginners — enough detail to find entries, enough context to see the bigger picture.
Quick Recap
- ✅ Timeframe = zoom level — same data, different perspectives
- ✅ Lower TFs (M1-M15) for scalping, Higher TFs (H4-D1) for swing trading
- ✅ Use top-down multi-timeframe analysis for the best results
- ✅ Beginners: start with H1 or H4 — not M1
- ✅ Pick 2-3 timeframes and stick with them