The Free Report That Shows You What Banks Are Betting On
Every Friday afternoon, the CFTC (Commodity Futures Trading Commission) releases a report that shows exactly how institutional traders — hedge funds, banks, asset managers — are positioned in major currencies. It's called the Commitment of Traders (COT) Report, and it's completely free.
While retail traders guess whether EUR/USD will go up or down, smart traders read the COT report and see what billion-dollar funds are actually doing with their money. This lesson teaches you how to read it.
What the COT Report Shows
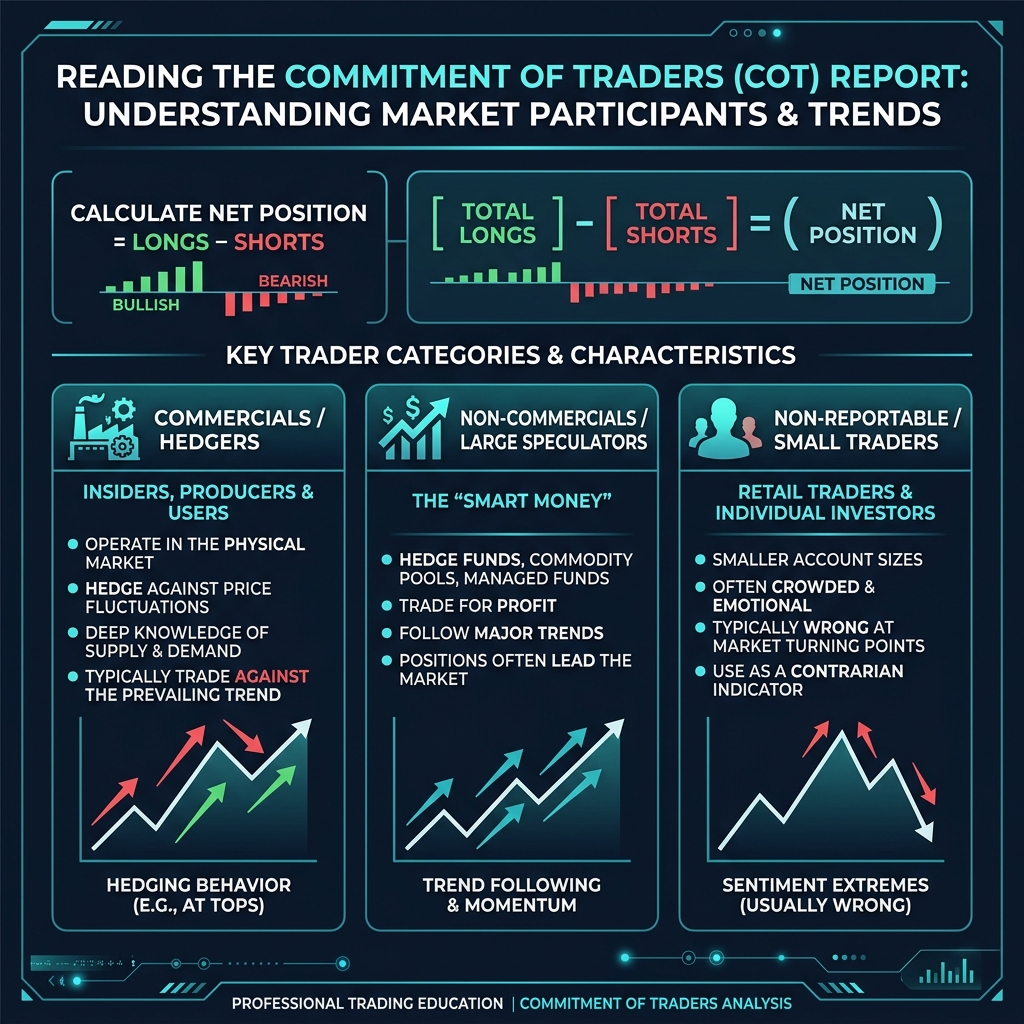
The COT report breaks down open interest (total positions) in currency futures by three categories of traders:
| Category | Who They Are | What They Tell You |
|---|---|---|
| Commercials (Hedgers) | Corporations, exporters, importers hedging real business | They trade AGAINST the trend — contrarian signal when extreme |
| Non-Commercials (Speculators) | Hedge funds, banks, asset managers | The "smart money" — FOLLOW their direction |
| Non-Reportable | Small traders (retail) | Usually on the wrong side — contrarian indicator |
Key insight: Focus on the Non-Commercial (speculative) positions. They represent the trend-following institutional money. When speculators are aggressively long a currency, it tends to strengthen. When they're aggressively short, it tends to weaken.
How to Read the COT Report — Step by Step
Step 1: Find the Report
Go to CFTC.gov → Market Reports → Commitments of Traders. Look for "Chicago Mercantile Exchange" → Currency futures. Or use a visual tool like tradingster.com, cotbase.com, or barchart.com which display COT data as graphs.
Step 2: Find Your Currency
COT data is reported for euro futures (EUR), British pound (GBP), Japanese yen (JPY), Australian dollar (AUD), Canadian dollar (CAD), and Swiss franc (CHF).
Step 3: Check Net Position
Net Position = Longs − Shorts for the Non-Commercial category.
- Positive net position: Speculators are collectively long → bullish for the currency
- Negative net position: Speculators are collectively short → bearish for the currency
- Extreme net position: When positioning hits multi-year highs/lows → potential reversal zone
Step 4: Watch the Change
The absolute number matters, but the weekly change matters more. If speculators were net long 50K contracts last week and now they're net long 30K, they're reducing bullish bets — that's a bearish signal even though the net position is still positive.
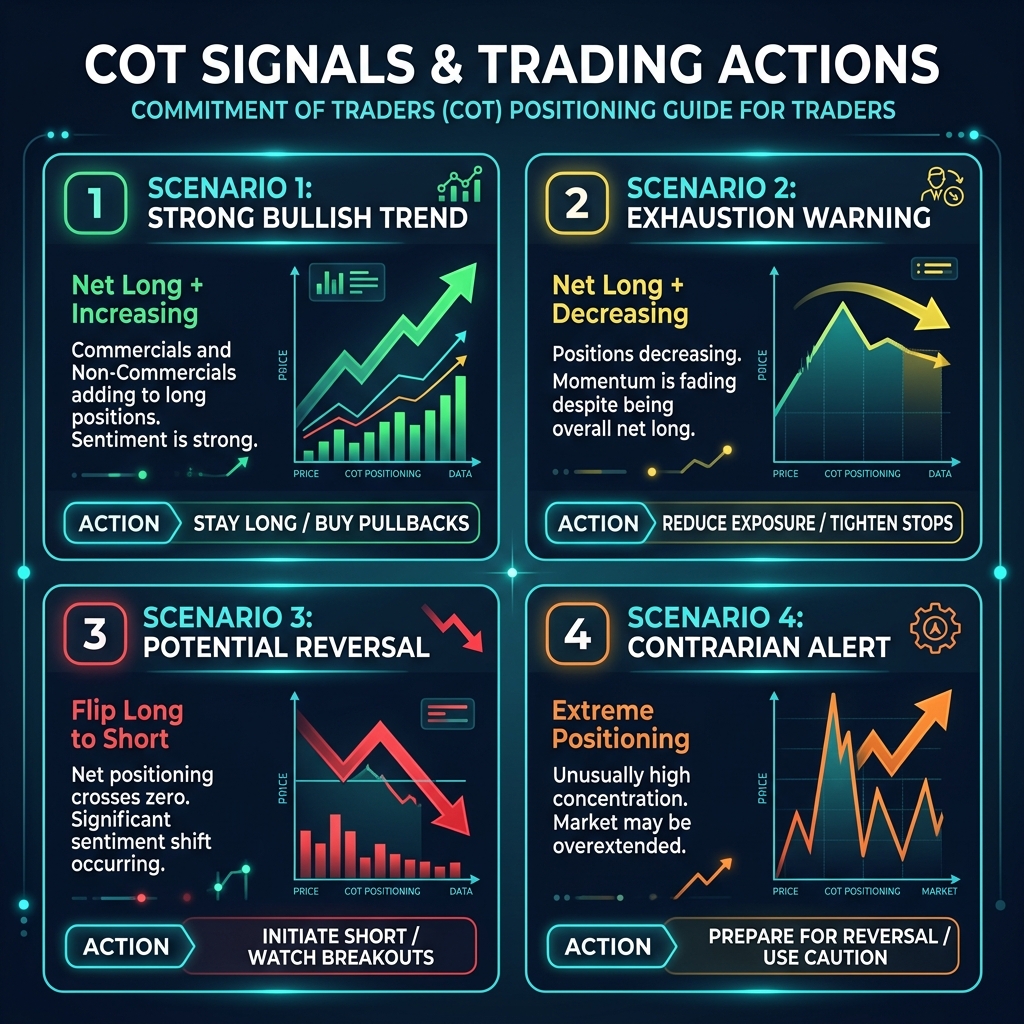
COT Signals in Practice
| COT Signal | What It Means | Trading Action |
|---|---|---|
| Speculators massively net long + position increasing | Strong institutional conviction — trend likely continues | Look for long entries on pullbacks |
| Speculators massively net long + position decreasing | Smart money taking profits — trend may be exhausting | Tighten stops, prepare for reversal |
| Speculators flip from net long to net short | Major sentiment shift — trend reversal likely | Look for short entries on rallies |
| Extreme positioning (multi-year high net longs) | Everyone who wants to buy already has — no fuel left | Contrarian signal — reversal watch |
Limitations of the COT Report
- Delayed data: The report covers Tuesday's data but is released Friday — it's 3 days old by the time you see it
- Futures ≠ Spot: COT covers futures markets, but spot forex positioning can differ
- Not a timing tool: An extreme position can get MORE extreme before reversing
- Works best for swing/position trading: The COT report shifts slowly — not useful for scalping or day trading
Best practice: Use COT as a directional bias filter. If COT speculators are net long EUR and your H4 chart shows a bullish pullback setup → that's a high-probability trade. If your technical setup conflicts with COT positioning → be cautious.
Quick Recap
- The COT Report shows how institutional speculators are positioned — released every Friday, free
- Focus on Non-Commercial (speculator) net positions — they represent smart money
- Direction of change matters more than the absolute number
- Extreme positioning often signals exhaustion and potential reversal
- COT is a long-term directional filter — not a timing tool
- Combine with technical analysis for highest-probability setups
🎯 Your Action Step
Visit tradingster.com (free COT charts). Look up EUR, GBP, and JPY. For each, note: (1) the net speculative position, (2) whether it's increasing or decreasing, (3) the current position relative to the last 12 months. Write down: "Speculators are [net long/short] EUR by [X contracts], and the position is [growing/shrinking]. My bias is [bullish/bearish]." Compare this with what the Daily chart shows. Do this every Sunday as part of your weekly prep.