The Chart Tells You Everything — If You Know How to Listen
Imagine walking into a room full of traders. Half of them are staring at candlestick charts, drawing lines, and watching indicators flash green and red. They're technical analysts — and they believe that everything you need to know is already in the price chart.
No news. No economic reports. Just price, patterns, and probabilities.
Technical analysis is the most popular approach for forex traders, and for good reason — it works across any market, any timeframe, and any trading style. This lesson gives you the big picture before we dive deep in later levels.
What Is Technical Analysis?
Technical analysis is the study of past price movements to predict future price direction. Instead of asking "why is the price moving?" (that's fundamental analysis), technical analysts ask "what is the price doing, and what's it likely to do next?"
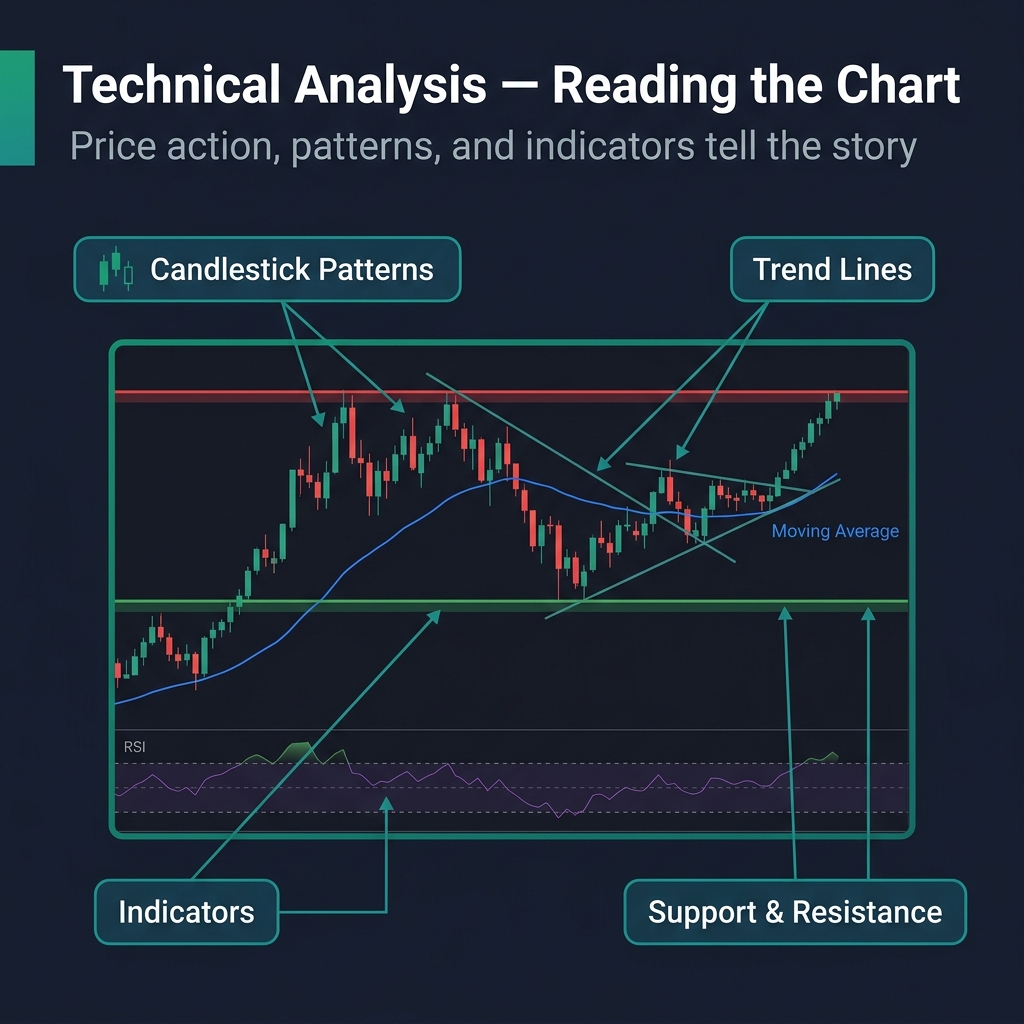
The core toolkit includes:
- Candlestick charts — Visualizing price action (open, high, low, close)
- Support & resistance — Key price levels where buying/selling pressure concentrates
- Trend lines — Connecting highs or lows to identify direction
- Chart patterns — Head & shoulders, triangles, flags, double tops
- Indicators — RSI, MACD, Moving Averages, Bollinger Bands
The 3 Core Principles
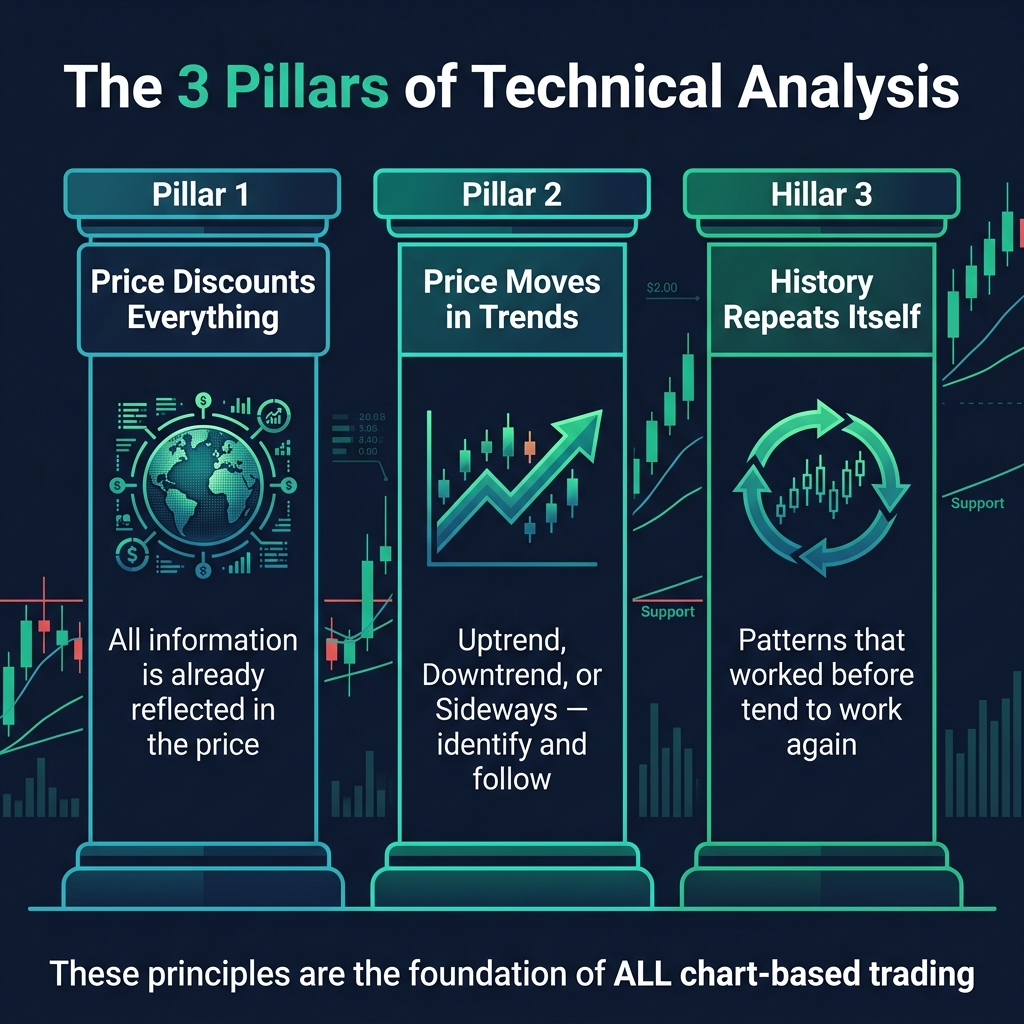
Every technical tool is built on three foundational beliefs:
1. Price Discounts Everything
All available information — economic data, news, investor sentiment, geopolitical events — is already reflected in the current price. The chart is the sum of everything the market knows.
2. Price Moves in Trends
Markets don't move randomly. They trend — up, down, or sideways. Once a trend starts, it's more likely to continue than reverse. Your job is to identify the trend and trade with it.
3. History Repeats Itself
Price patterns that appeared in the past tend to appear again. Human psychology doesn't change — fear and greed create the same chart formations across decades and markets.
What Can Technical Analysis Do For You?
| TA Can Do This | TA Can NOT Do This |
|---|---|
| Identify trends and reversals | Predict the future with certainty |
| Find entry and exit points | Tell you why price is moving |
| Set precise stop losses and targets | Work 100% of the time |
| Measure momentum and volatility | Replace risk management |
| Work on any market and timeframe | Predict news-driven spikes |
Technical analysis gives you probabilities, not certainties. It tells you: "70% of the time when this pattern appears, price does X." That edge, combined with good risk management, is enough to be profitable.
TA vs FA — Do You Have to Choose?
Short answer: no. The best traders use both. But here's the practical reality:
- Scalpers and day traders rely 90%+ on technical analysis — fundamentals don't matter on a 5-minute chart
- Swing traders use technical analysis for entries/exits and fundamental analysis for overall direction
- Position traders lean more on fundamental analysis but use technical analysis to time their entries
In this academy, we'll teach you all three approaches. But technical analysis is your core skill — the language every trader must speak.
Quick Recap
- ✅ Technical analysis studies past price to predict future moves
- ✅ Three principles: price discounts everything, trends exist, history repeats
- ✅ Tools: candlesticks, support/resistance, indicators, patterns
- ✅ It gives probabilities, not certainties — combine with risk management
- ✅ Works on any market and timeframe
🎯 Your Action Step
Open any forex chart on your platform and switch to the daily timeframe. Zoom out to see 6 months of data. Can you identify an uptrend, downtrend, or sideways period? That's your first technical analysis — and you didn't need a single indicator.