The Market's Memory — When Floors Become Ceilings
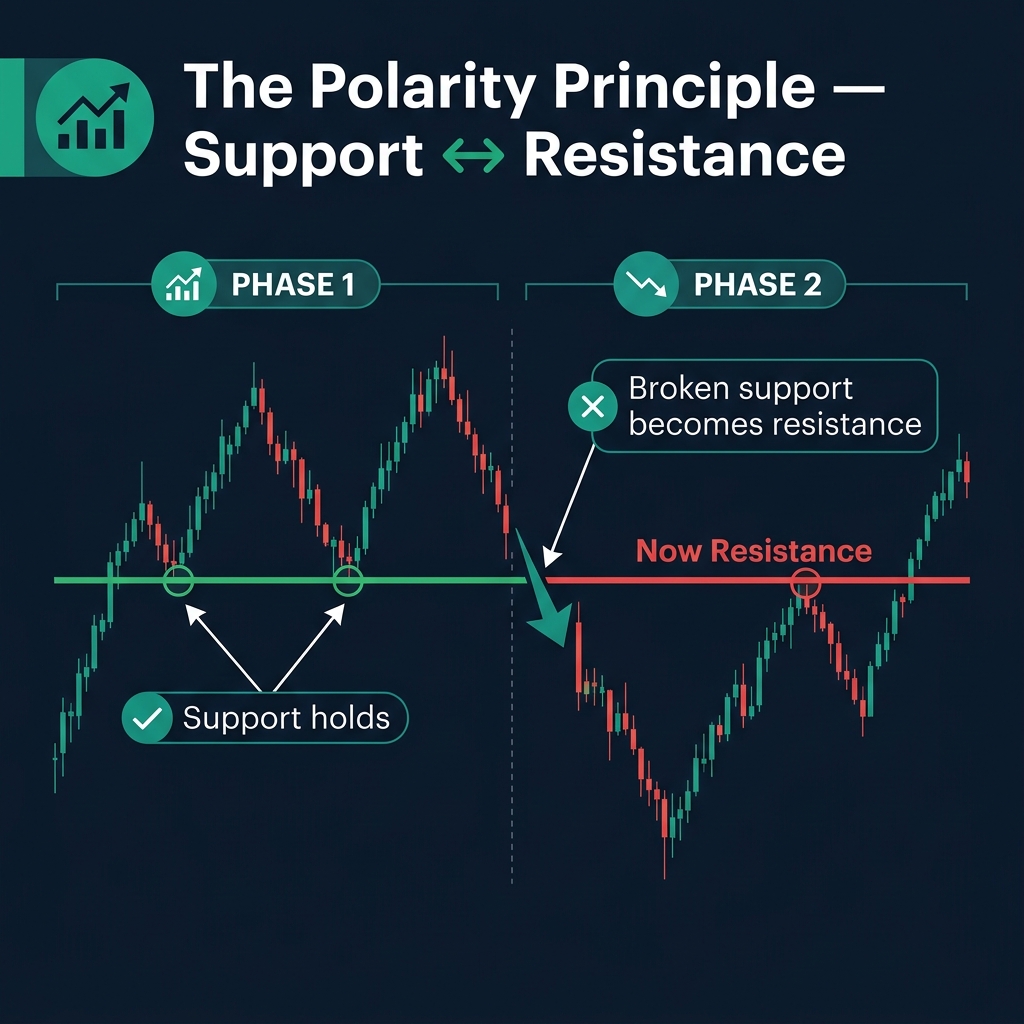
Here's one of the most powerful concepts in all of trading: when a support level breaks, it doesn't disappear. It changes its role. The old floor becomes a new ceiling. And vice versa.
This phenomenon is called the Polarity Principle — and once you understand it, you'll see trading opportunities that most beginners completely miss.
Why does this happen? Because of trader psychology. The same people who were buying at support are now trapped — and when price returns to that level, they're desperate to exit at break-even. Their selling creates the new resistance.
How the Polarity Principle Works
Let's walk through the psychology step by step:
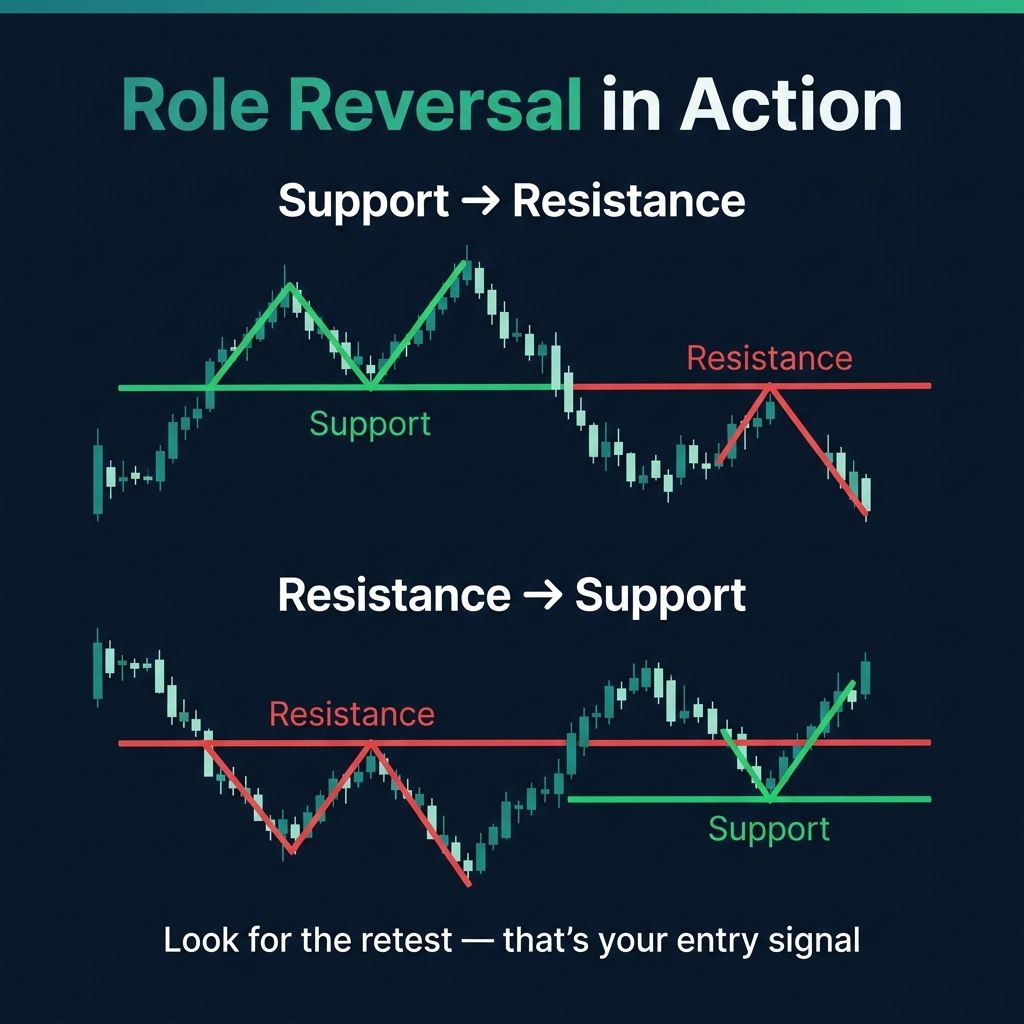
Support → Resistance (Bearish Scenario)
- Price bounces off a support level multiple times — traders are buying here
- Eventually, selling pressure overwhelms the buyers — support breaks
- Price drops, then retests the broken support from below
- Trapped buyers now sell at breakeven → the old support becomes new resistance
Resistance → Support (Bullish Scenario)
- Price hits resistance and gets rejected — sellers are defending this level
- Eventually, buying pressure overwhelms sellers — resistance breaks
- Price rises, then pulls back to retest the broken resistance
- Previous sellers are now trapped — new buyers step in → old resistance becomes new support
🧠 The key insight: The retest after a breakout is often the best entry point in trading. It gives you confirmation that the level has truly changed its role.
Trading the Retest — Your Edge
The retest strategy is one of the most reliable setups in trading. Here's how to execute it:
| Step | What to Do | What to Look For |
|---|---|---|
| 1. Identify the break | Wait for price to close beyond S&R (not just wick through) | Strong momentum candle — big body, small wicks |
| 2. Wait for retest | Let price pull back to the broken level | Patience! Don't chase the breakout |
| 3. Confirm the flip | Look for rejection at the level (candle signal) | Pin bar, engulfing, or doji at the level |
| 4. Enter the trade | Enter in the direction of the break | Stop loss on the other side of the zone |
⚠️ Warning: Not every breakout leads to a retest. Some breakouts are so strong that price never comes back. That's okay — missing the entry is better than chasing a trade.
Why Does This Work? The Psychology
Three groups of traders create the polarity effect:
- The Trapped Traders — Bought at support that broke. When price retests, they sell to minimize their loss. Their selling at the old support creates resistance.
- The Late Sellers — Missed the initial breakout downward. They see the retest as their second chance to enter short. Their selling adds to resistance.
- The Smart Money — Institutional traders who caused the breakout. They wait for the retest to add to their positions at a better price.
All three groups are acting at the same level, at the same time, in the same direction. This convergence of psychology is what makes polarity so powerful.
Practical Rules for Polarity Trading
- The break must be convincing — A single wick poking through isn't a real break. Look for a close beyond the level.
- Timeframe matters — A break on the Daily chart is far more significant than one on M15.
- The first retest is the strongest — The more times a level is retested, the weaker the polarity effect becomes.
- Volume confirms — If the break happens on high volume and the retest on low volume, the flip is likely real.
Quick Recap
- ✅ Broken support → new resistance. Broken resistance → new support.
- ✅ The retest after a breakout is a high-probability entry signal
- ✅ Polarity works because of trapped traders, late entries, and smart money all acting at the same level
- ✅ The break must be convincing — look for a candle close beyond the level
- ✅ The first retest is strongest — subsequent retests weaken the level
🎯 Your Action Step
Go back to your EUR/USD Daily chart. Find a level that was previously support but has since been broken. Did price come back to retest it? Did it act as resistance? Identify at least 2 examples of role reversal on your chart. This pattern happens on every instrument, every timeframe.