The Two Lines That Control Every Market Move
Strip away every indicator, every oscillator, every fancy overlay — and you're left with two invisible forces that drive every price movement in every market: Support and Resistance.
These aren't just random lines on a chart. They're the fingerprints of buyer and seller decisions. Every time price bounces off a level, it's because real traders — banks, institutions, retail — are making decisions at that exact price.
Master these two concepts, and you'll understand why price moves the way it does. Ignore them, and you're trading blind.
What Is Support?
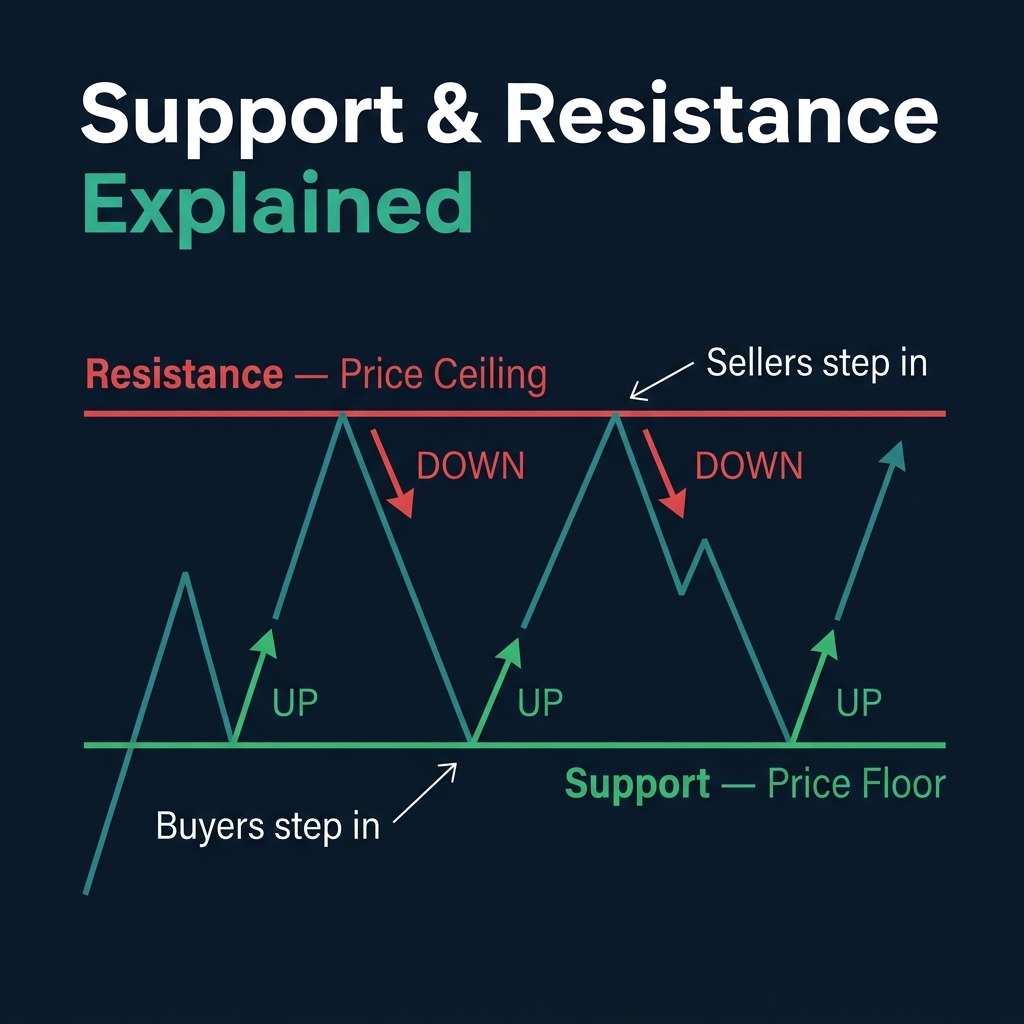
Support is a price level where buying pressure is strong enough to prevent the price from falling further. Think of it as a floor beneath the market.
Why does support form? Because at certain prices, traders see value:
- Buyers who missed the previous move — are waiting to buy at a "discount"
- Short sellers taking profits — closing their positions pushes price back up
- Institutional orders — large buy orders parked at key levels
When enough buyers agree on a price level, their combined demand creates a floor that supports the price.
What Is Resistance?
Resistance is a price level where selling pressure is strong enough to stop price from rising further. Think of it as a ceiling above the market.
Why does resistance form? The opposite psychology applies:
- Traders who bought lower — are taking profits at this level
- Short sellers entering — see value in selling at high prices
- Previous buyers who got trapped — want to exit at break-even when price returns
🧠 Key insight: Support and resistance are not exact prices — they're zones where decisions cluster. Think of them as price neighborhoods, not street addresses.
Two Ways to Trade S&R: Bounce vs Break
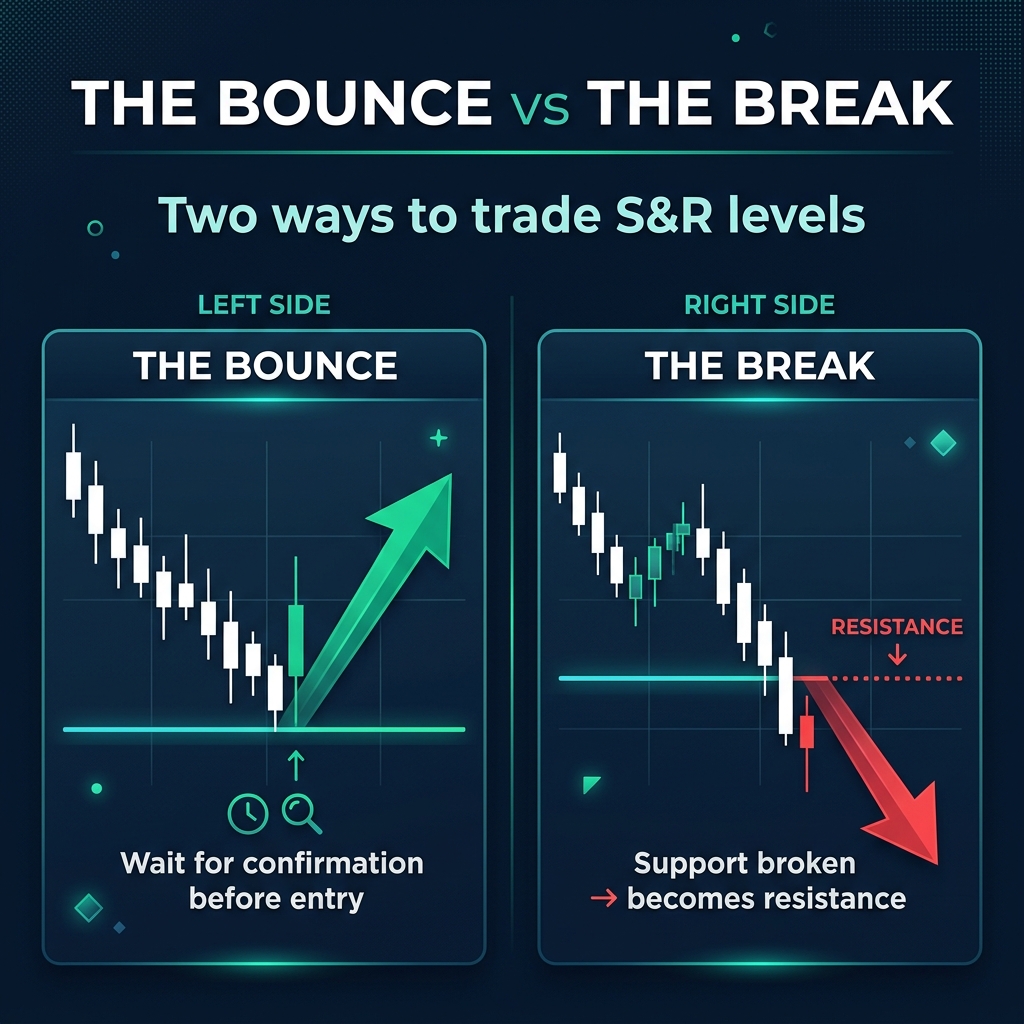
Once you've identified S&R levels, there are only two things that can happen — and two ways to profit:
1. The Bounce
Price approaches a support or resistance level and bounces back. This is the most common reaction.
- At support: Look for buying opportunities (price bounces UP)
- At resistance: Look for selling opportunities (price bounces DOWN)
- Critical rule: Don't trade the bounce blindly — wait for a confirmation candle (like a hammer or engulfing pattern)
2. The Break
Price breaks through a support or resistance level with momentum. This signals a potential new trend.
- When support breaks: The broken support often becomes new resistance (more on this in a later lesson)
- When resistance breaks: The broken resistance often becomes new support
- Watch out: Many breakouts are false. Wait for price to close beyond the level before committing
How to Identify Strong S&R Levels
Not all levels are created equal. Here's what makes an S&R level strong:
| Factor | Why It Matters |
|---|---|
| Number of touches | More bounces = more traders are watching this level |
| Timeframe | A level on the Daily chart is stronger than one on M15 |
| Volume at the level | High volume rejections = institutional interest |
| Recency | Recent levels are more relevant than levels from years ago |
| Round numbers | Prices like 1.1000 or 1.2000 attract more orders (covered in Lesson 5) |
🎯 Pro tip: Focus on levels with at least 2-3 clear touches. If price has only touched a level once, it's weak and unreliable.
Common Mistakes with S&R
- "I need to draw lines at every possible level" — No. Too many lines create confusion. Stick to 2-3 major levels on your chart.
- "Support and resistance are exact prices" — They're zones, not lines. Give yourself a margin of ±5-10 pips.
- "If the level held once, it'll hold forever" — Every level eventually breaks. The question is whether to trade the bounce or the break.
- "I only need S&R, nothing else" — S&R is your foundation, but confirmation (candlestick patterns, volume) makes them powerful.
Quick Recap
- ✅ Support = floor (buyers defend this price)
- ✅ Resistance = ceiling (sellers defend this price)
- ✅ Trade the Bounce (price respects the level) or the Break (price pushes through)
- ✅ S&R are zones, not exact lines — give them breathing room
- ✅ Strong levels have multiple touches, high timeframe confirmation, and volume
🎯 Your Action Step
Open your chart to the Daily timeframe on EUR/USD. Identify the 2 most obvious support levels and the 2 most obvious resistance levels from the last 3 months. Draw horizontal lines at each zone. Now watch: how does price react when it approaches these levels?