RSI's Faster Cousin
If the RSI tells you "the market is overbought," the Stochastic Oscillator tells you "the market is overbought AND momentum is already turning." The Stochastic adds a speed element — it compares today's closing price to its price range over a set period, giving you earlier signals than the RSI.
The trade-off? More signals = more noise. That's why understanding the difference between Fast and Slow Stochastic is crucial.
Fast vs Slow Stochastic
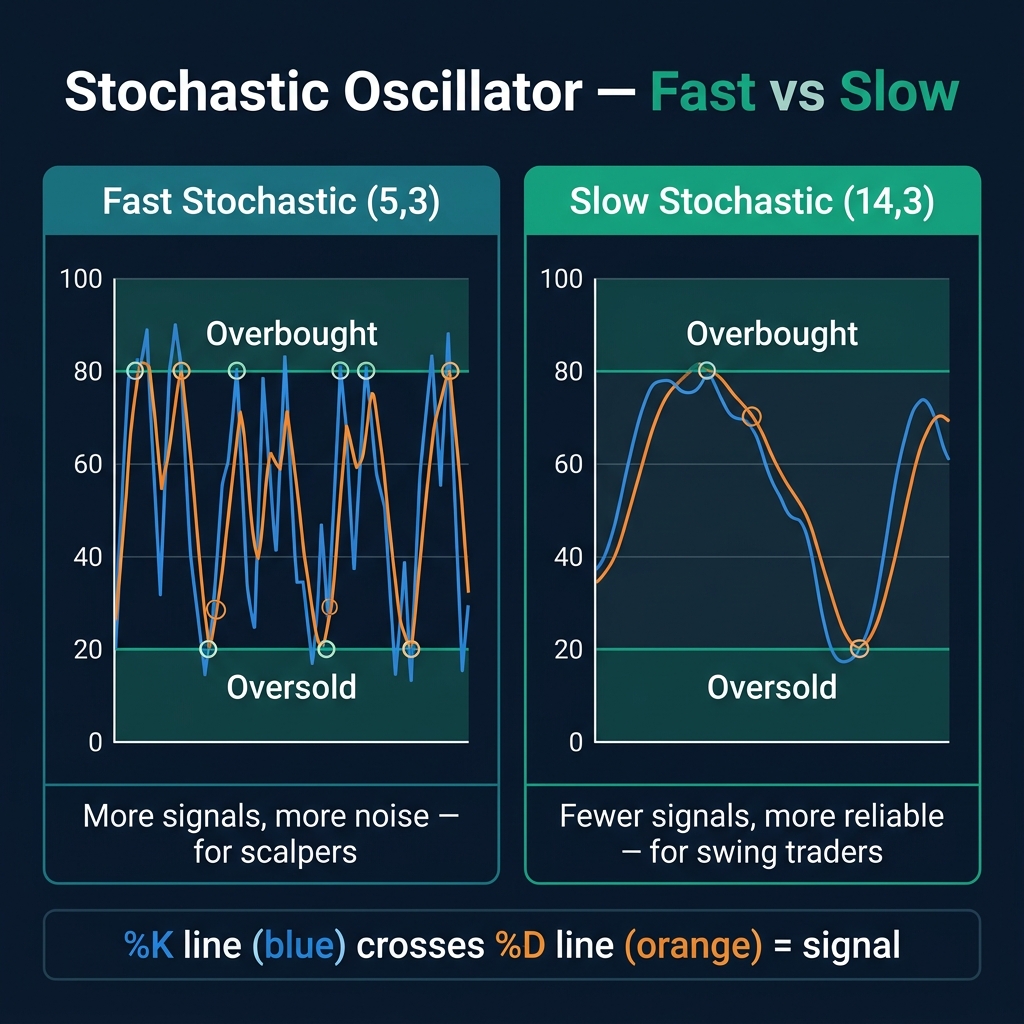
The Stochastic has two lines — %K (fast line) and %D (signal line). When %K crosses %D, you get a trading signal.
| Type | Settings | Speed | Best For |
|---|---|---|---|
| Fast Stochastic | 5, 3 | Very responsive, jumpy | Scalping, M5-M15 charts |
| Slow Stochastic | 14, 3 | Smoother, trustworthy | Swing trading, H4-Daily |
💡 The rule of thumb: If you're a beginner, use the Slow Stochastic (14, 3). It filters out noise and gives cleaner signals. Save the Fast version for when you have more screen time experience.
How to Trade Stochastic Crossovers
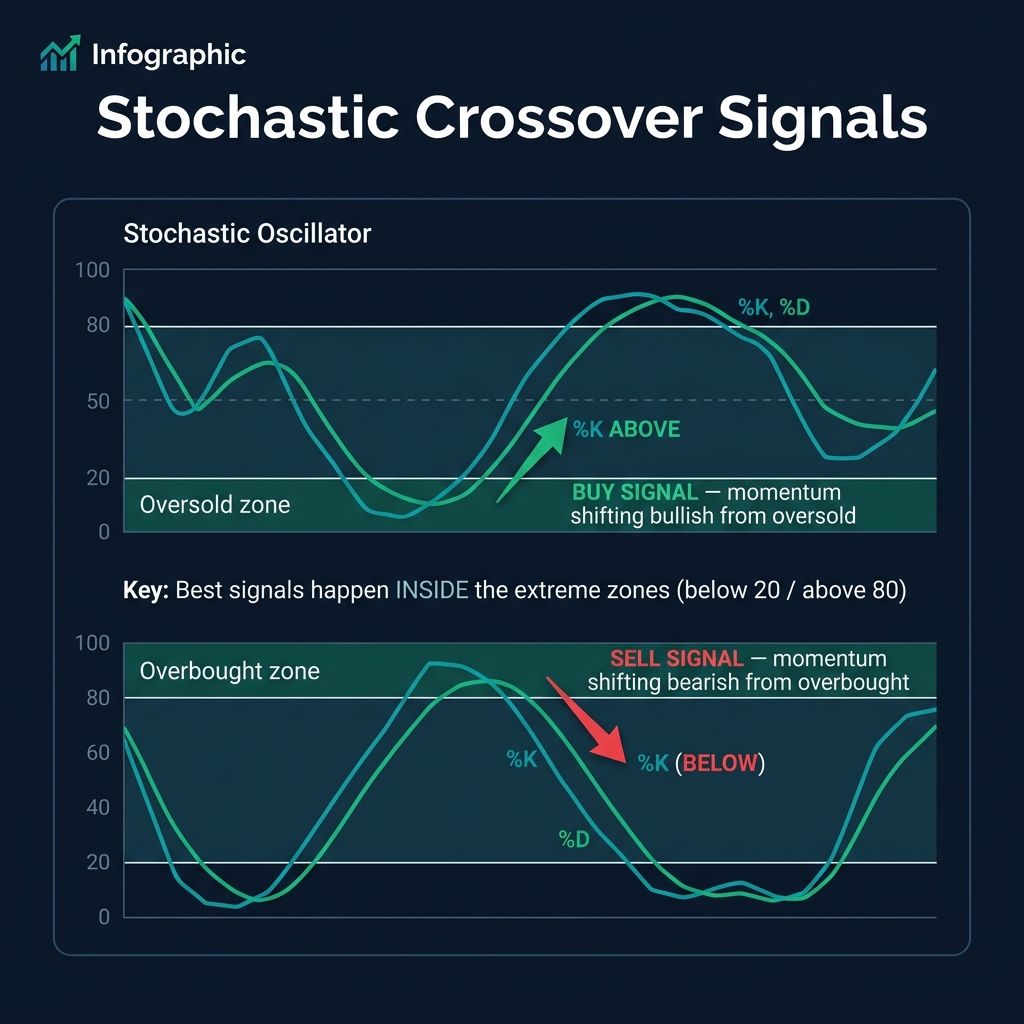
Buy Signal
- Stochastic drops below 20 (oversold)
- %K crosses above %D while in the oversold zone
- Confirm with a bullish candlestick pattern and S&R level
Sell Signal
- Stochastic rises above 80 (overbought)
- %K crosses below %D while in the overbought zone
- Confirm with a bearish candlestick pattern and resistance level
⚠️ Key rule: The best Stochastic signals happen inside the extreme zones. A crossover at 50 is weak. A crossover below 20 or above 80 is much more reliable.
Stochastic vs RSI
| Feature | RSI | Stochastic |
|---|---|---|
| Speed | Slower, smoother | Faster, more signals |
| Best for | Trend momentum, divergence | Crossover timing, range trading |
| Zones | Above 70 / Below 30 | Above 80 / Below 20 |
| Strengths | Trend analysis | Entry timing |
Quick Recap
- ✅ Stochastic compares closing price to the price range over a set period
- ✅ Fast (5,3) = more signals, more noise. Slow (14,3) = cleaner, more reliable
- ✅ Best signals: %K crosses %D inside extreme zones (below 20 / above 80)
- ✅ Works best in ranging markets — less reliable in strong trends
- ✅ Combine with S&R and candlestick patterns for confirmation
🎯 Your Action Step
Add the Slow Stochastic (14, 3) to GBP/USD on the H4 chart. Find a %K/%D crossover below 20 (buy) or above 80 (sell). Was there a corresponding S&R level nearby? Did the trade work? This shows you the power — and limitations — of oscillator timing.