The Tortoise and the Hare of Trading
Moving averages are the single most-used indicator in trading. From Wall Street institutional desks to retail traders in their bedrooms — everyone watches them. But here's the problem: there are two types, and most beginners don't know the difference.
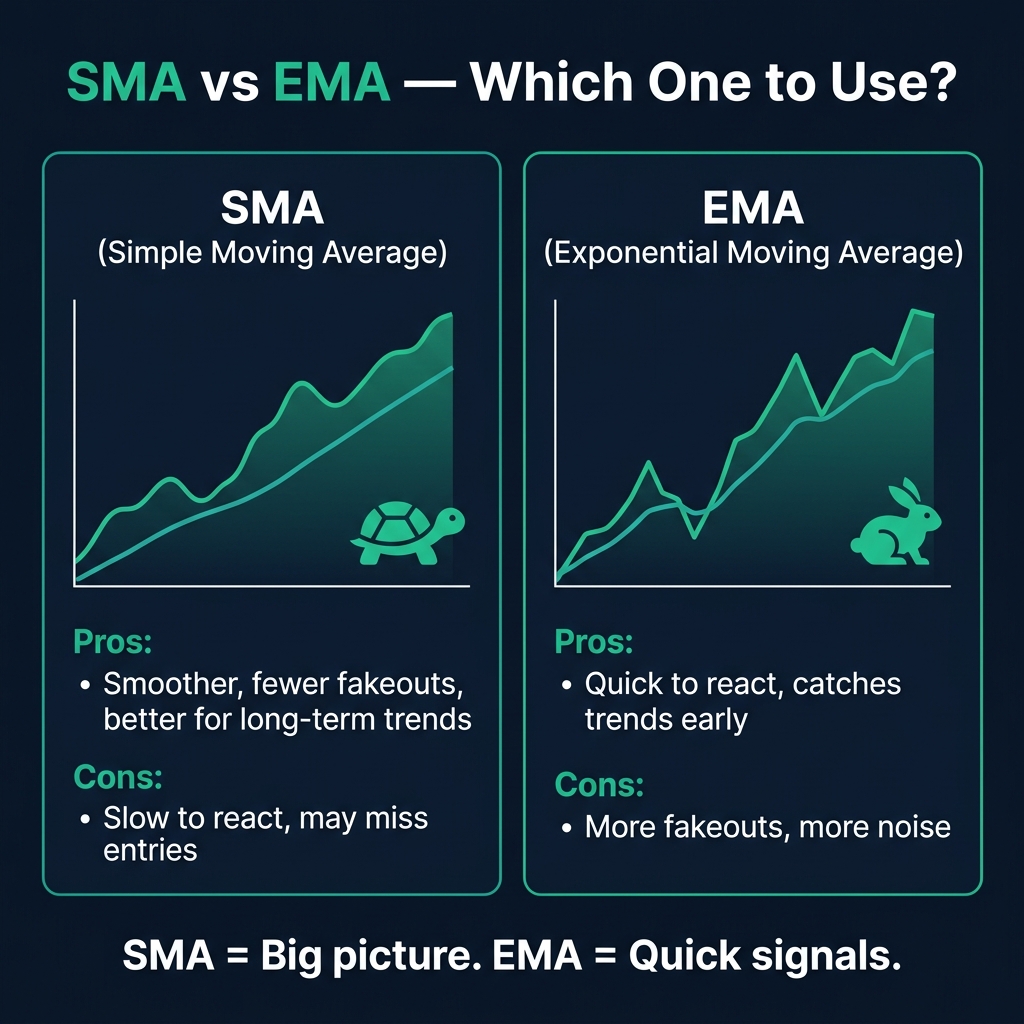
The SMA (Simple Moving Average) is like a tortoise — slow, steady, and reliable. The EMA (Exponential Moving Average) is like a hare — fast, responsive, but sometimes jumpy. Understanding when to use each one is the difference between catching a trend early and getting faked out.
SMA vs EMA — The Core Difference
| Feature | SMA (Simple) | EMA (Exponential) |
|---|---|---|
| Calculation | Equal weight to all prices | More weight to recent prices |
| Speed | Slower — lags behind price | Faster — reacts to price quickly |
| Smoothness | Very smooth line | Choppier, follows price closely |
| Best for | Long-term trend identification | Short-term trading signals |
| Weakness | May miss entries (too slow) | More fakeouts (too fast) |
How SMA Works
The SMA adds up the closing prices over a set period and divides by that number. A 20-day SMA = sum of last 20 closing prices ÷ 20. Every day is weighted equally — yesterday counts as much as 20 days ago.
How EMA Works
The EMA uses a multiplier that gives more importance to recent prices. This means it reacts faster to new price data. The formula is more complex, but your trading platform does the math for you.
💡 In plain English: SMA is the class average. EMA is the weighted average that cares more about your recent test scores.
Choosing the Right Period
| Period | Best For | Trading Style |
|---|---|---|
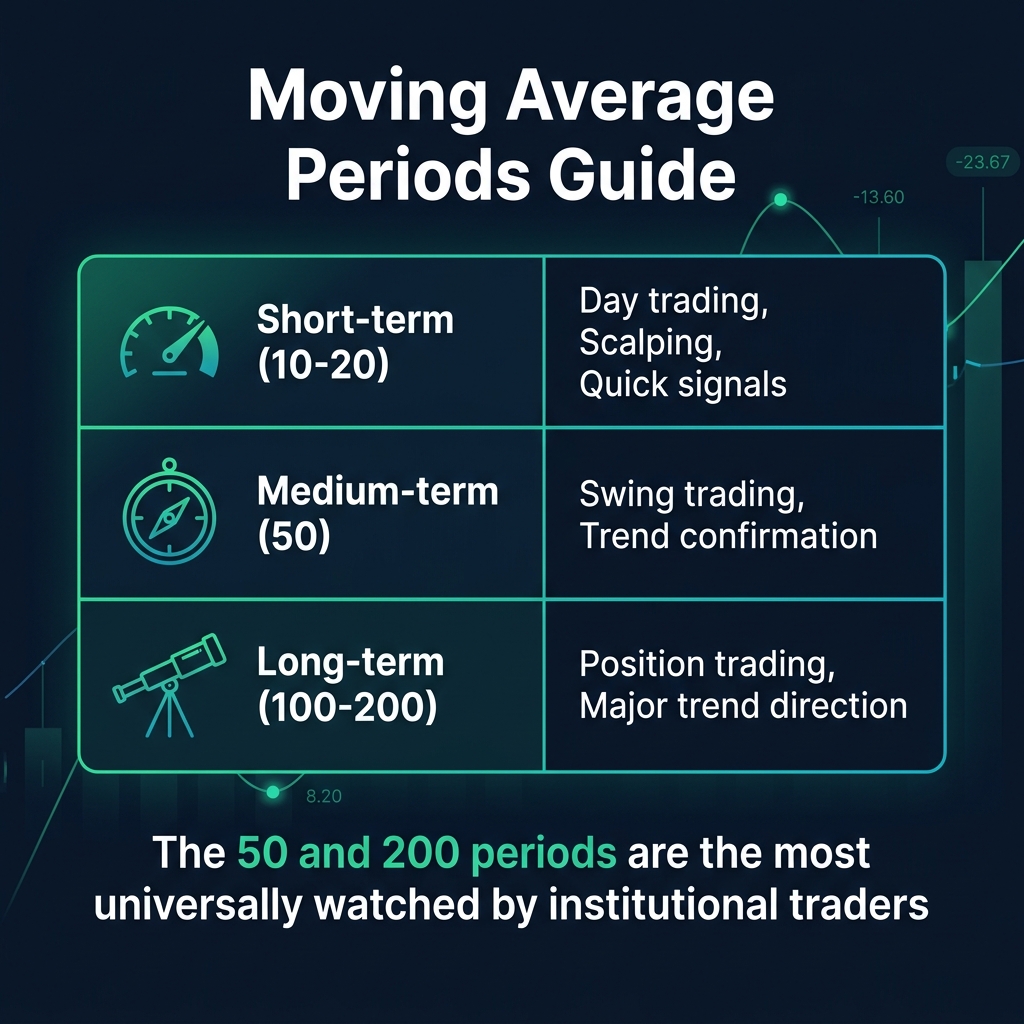
| 10-20 | Quick signals, pullback entries | Day trading, scalping |
| 50 | Trend confirmation, crossovers | Swing trading |
| 100-200 | Major trend direction, institutional levels | Position trading, big-picture bias |
🎯 The combo approach: Many professional traders plot BOTH — a long-term SMA (200) to see the big picture, and a short-term EMA (20) to time their entries. They're not choosing one. They're using both for different purposes.
When to Use SMA vs EMA
Use SMA when:
- You want a clear, smooth view of the overall trend
- You're looking at Daily or Weekly charts
- You want to avoid fakeouts in volatile markets
- You're identifying long-term support/resistance (200 SMA)
Use EMA when:
- You need quick signals for short-term trades
- You're trading H1 or lower timeframes
- You want to catch trends early
- You're using crossover strategies
Quick Recap
- ✅ SMA = equal weight to all prices → smoother, slower, fewer fakeouts
- ✅ EMA = more weight on recent prices → faster, more responsive
- ✅ Short periods (10-20) = quick signals → day trading
- ✅ Long periods (100-200) = big picture → position trading
- ✅ Best approach: Use SMA for trend direction + EMA for entry timing
🎯 Your Action Step
Open EUR/USD on the Daily chart. Add a 200 SMA and a 20 EMA. Watch how the 200 SMA shows the big-picture trend, while the 20 EMA follows price much more closely. Find 3 places where price pulled back to the 20 EMA and bounced. That's the EMA doing its job.