The Most Popular Indicator in Trading
If there was one indicator that every trader — from beginners to hedge fund managers — knows by name, it's the RSI (Relative Strength Index). Developed by J. Welles Wilder in 1978, the RSI measures the speed and magnitude of price movements on a scale from 0 to 100.
It answers one simple question: "Is the market overextended?" When it is, a reversal may be coming. But as you'll discover, the RSI has a secret weapon that most beginners miss — divergence.
Overbought and Oversold Zones
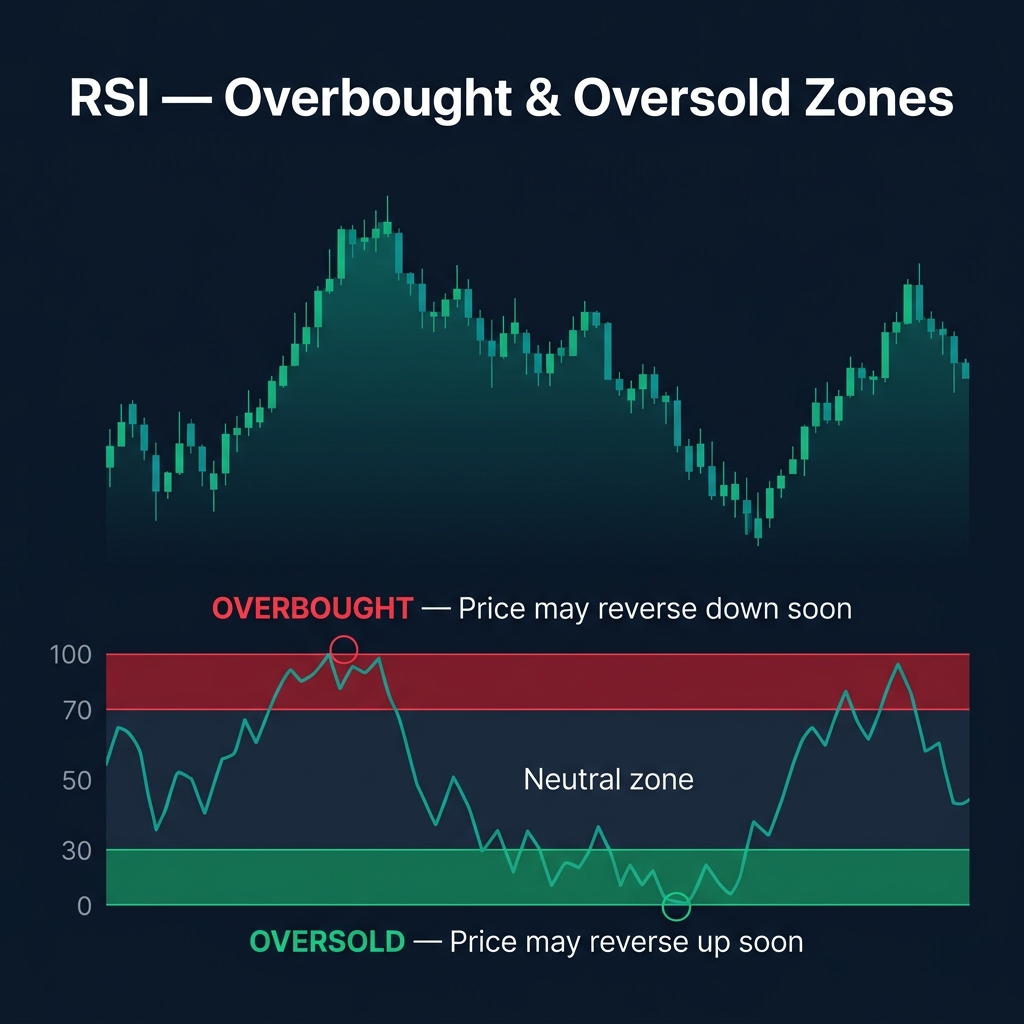
The RSI oscillates between 0 and 100, with two critical zones:
| RSI Reading | Zone | What It Signals |
|---|---|---|
| Above 70 | Overbought 🔴 | Price has risen too fast — a pullback or reversal may be near |
| 30-70 | Neutral ⚪ | Normal momentum — no extreme signal |
| Below 30 | Oversold 🟢 | Price has fallen too fast — a bounce or reversal may be near |
⚠️ Critical mistake: "RSI is overbought, so I'll sell!" — This is wrong. In a strong uptrend, the RSI can stay overbought for weeks. Overbought ≠ "sell now." It means "be cautious" — look for confirming reversal signals before acting.
How to Use RSI Properly
- In a trending market: Use RSI to find pullback entries. In an uptrend, buy when RSI drops to ~40 (not 30) and bounces
- In a ranging market: Trade the bounces between 30 and 70 — sell at 70, buy at 30
- Never trade RSI alone: Always combine with S&R, candlestick patterns, or trend analysis
RSI Divergence — The Hidden Signal
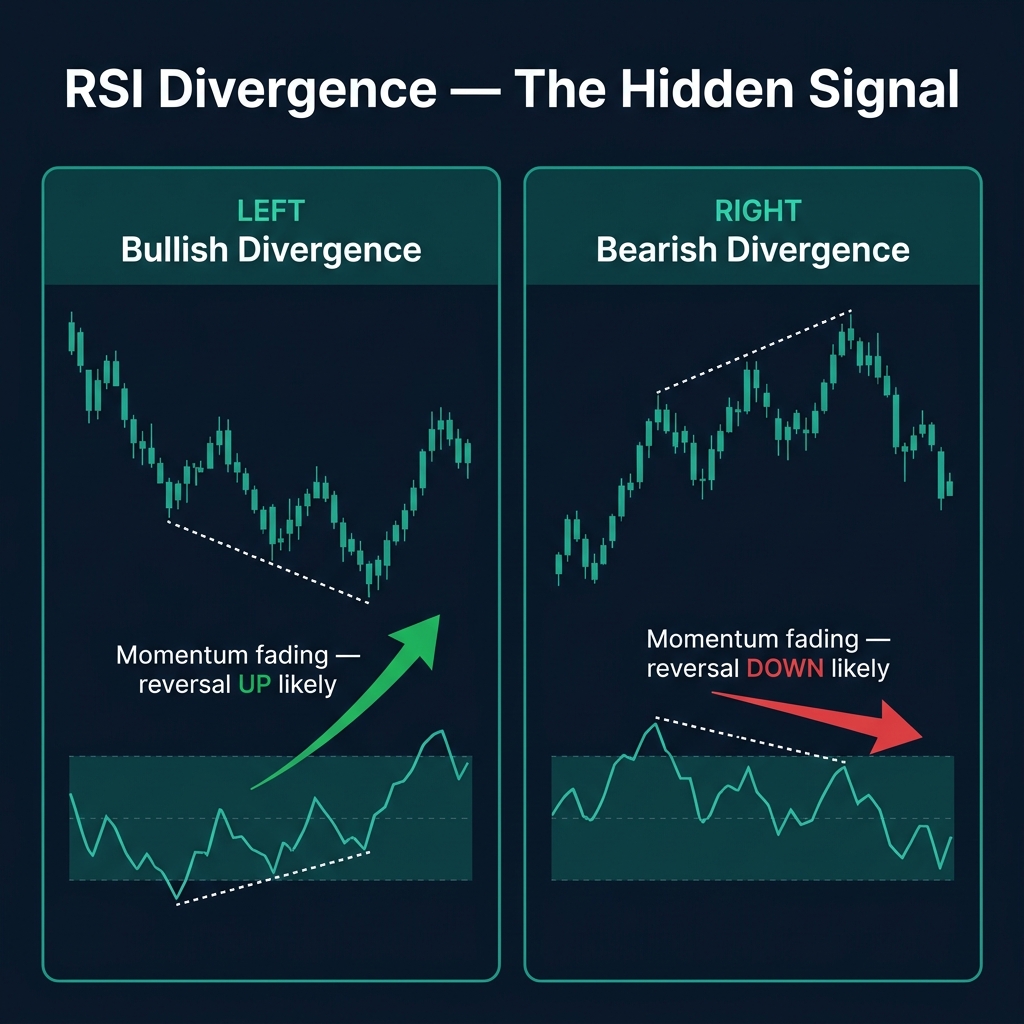
Divergence is the RSI's most powerful signal — and most traders ignore it. It occurs when price moves in one direction, but the RSI moves in the opposite direction.
Bullish Divergence (Buy Signal)
- Price makes a lower low
- RSI makes a higher low
- Meaning: the downward momentum is fading — a reversal UP is likely
Bearish Divergence (Sell Signal)
- Price makes a higher high
- RSI makes a lower high
- Meaning: the upward momentum is fading — a reversal DOWN is likely
🎯 Pro tip: Divergence at a key S&R level is one of the most reliable reversal signals in trading. When RSI divergence appears at the 61.8% Fibonacci level or a major support zone — that's an A-grade setup.
RSI Settings Quick Guide
| Setting | Period | Best For |
|---|---|---|
| Default | 14 | Standard analysis on any timeframe |
| Fast | 7-9 | Scalping, day trading — more signals but more noise |
| Slow | 21-25 | Swing trading, longer-term — fewer but more reliable signals |
Quick Recap
- ✅ RSI measures momentum on a 0-100 scale
- ✅ Above 70 = overbought (caution). Below 30 = oversold (caution)
- ✅ Divergence is the most powerful RSI signal — when price and RSI disagree
- ✅ In trends, RSI can stay overbought/oversold for extended periods — don't blindly counter-trade
- ✅ Combine RSI with S&R, Fibonacci, and candlestick patterns for best results
🎯 Your Action Step
Add the RSI (14) to your EUR/USD Daily chart. Find one instance of RSI divergence from the last 3 months. Did price reverse after the divergence? How many pips did the reversal produce? This is how professionals use RSI — not the basic overbought/oversold, but the divergence that tells you what's really happening beneath the surface.