The Hidden Warning Your Indicators Are Screaming
Price just made a new high. Your chart looks bullish. Everything says "buy." But underneath that shiny new high, the RSI is quietly doing the opposite — making a lower high. That's divergence. And if you ignore it, you're about to take a trade right before the market reverses in your face.
Regular divergence is one of the most powerful early-warning systems in trading. It tells you that momentum is dying before price actually turns — giving you a head start that most traders never get.
What Is Regular Divergence?
Divergence happens when price and an oscillator (RSI, MACD, Stochastic) disagree about the direction of momentum. Think of it this way:
- Price = what the market is doing right now
- Indicator = the fuel behind the move
When price keeps climbing but the indicator says "the engine is running out of gas," that's divergence. The car is still rolling forward, but it's about to stall.
Regular divergence specifically signals a potential trend reversal. It's different from hidden divergence (which signals continuation — we'll cover that in the next lesson).
Two Types of Regular Divergence
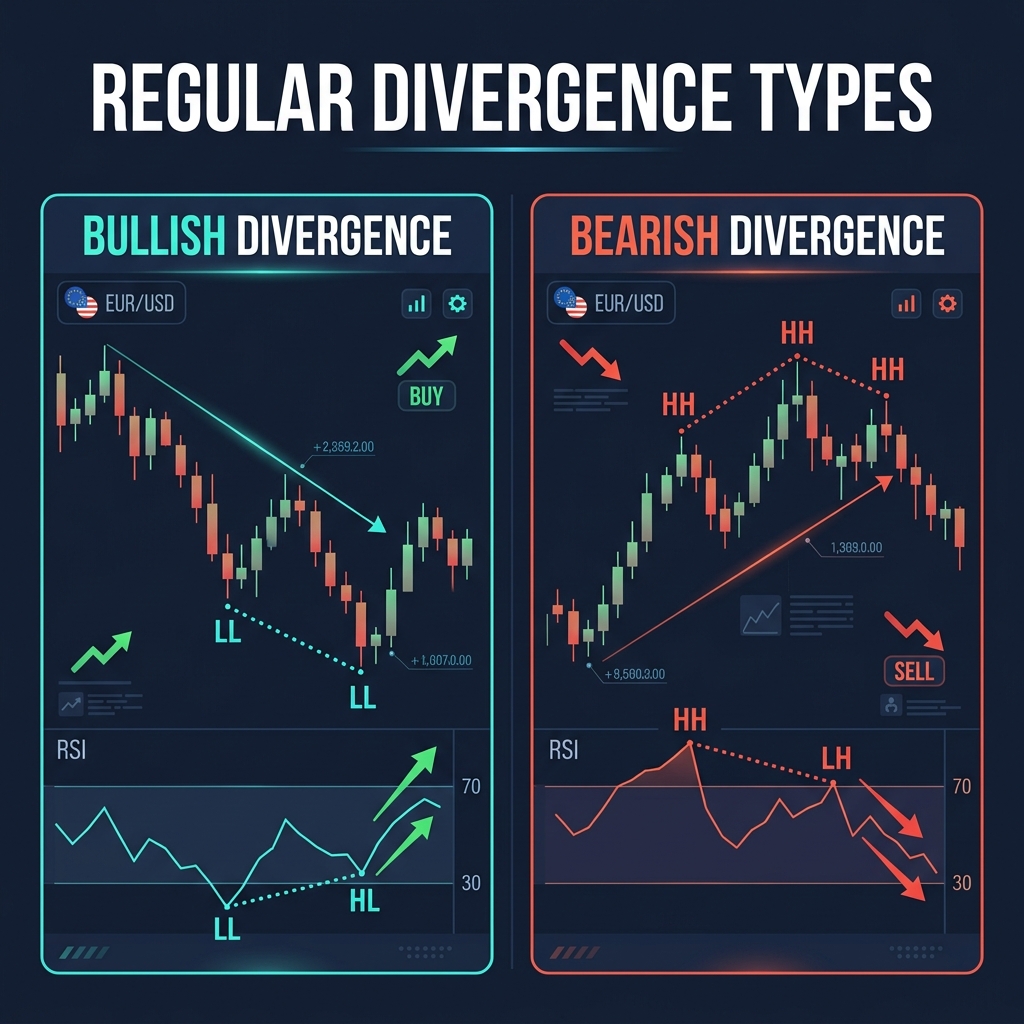
Bullish Regular Divergence (Reversal Up)
Price makes a lower low, but RSI makes a higher low.
Translation: sellers are pushing price down, but they're getting weaker with each push. The downtrend is running out of fuel. A bounce or full reversal may be coming.
Real example: EUR/USD drops from 1.0950 to 1.0880 (lower low), but RSI goes from 28 to 32 (higher low). The selling pressure is exhausted. Price reverses and climbs back to 1.0960 within 48 hours.
Bearish Regular Divergence (Reversal Down)
Price makes a higher high, but RSI makes a lower high.
Translation: buyers are still pushing price up, but with less force each time. The uptrend is losing steam. A pullback or reversal is likely.
Real example: GBP/USD pushes from 1.2650 to 1.2720 (higher high), but RSI drops from 74 to 68 (lower high). Buyers are exhausted. Price drops 90 pips over the next two sessions.
| Type | Price Action | RSI Behavior | Signal | Best Used At |
|---|---|---|---|---|
| Bullish Regular | Lower Low | Higher Low | Reversal Up ↑ | End of downtrend |
| Bearish Regular | Higher High | Lower High | Reversal Down ↓ | End of uptrend |
How to Trade Regular Divergence — Step by Step
Spotting divergence is step one. But divergence alone is NOT a trade signal — it's a warning light. Here's the complete process:
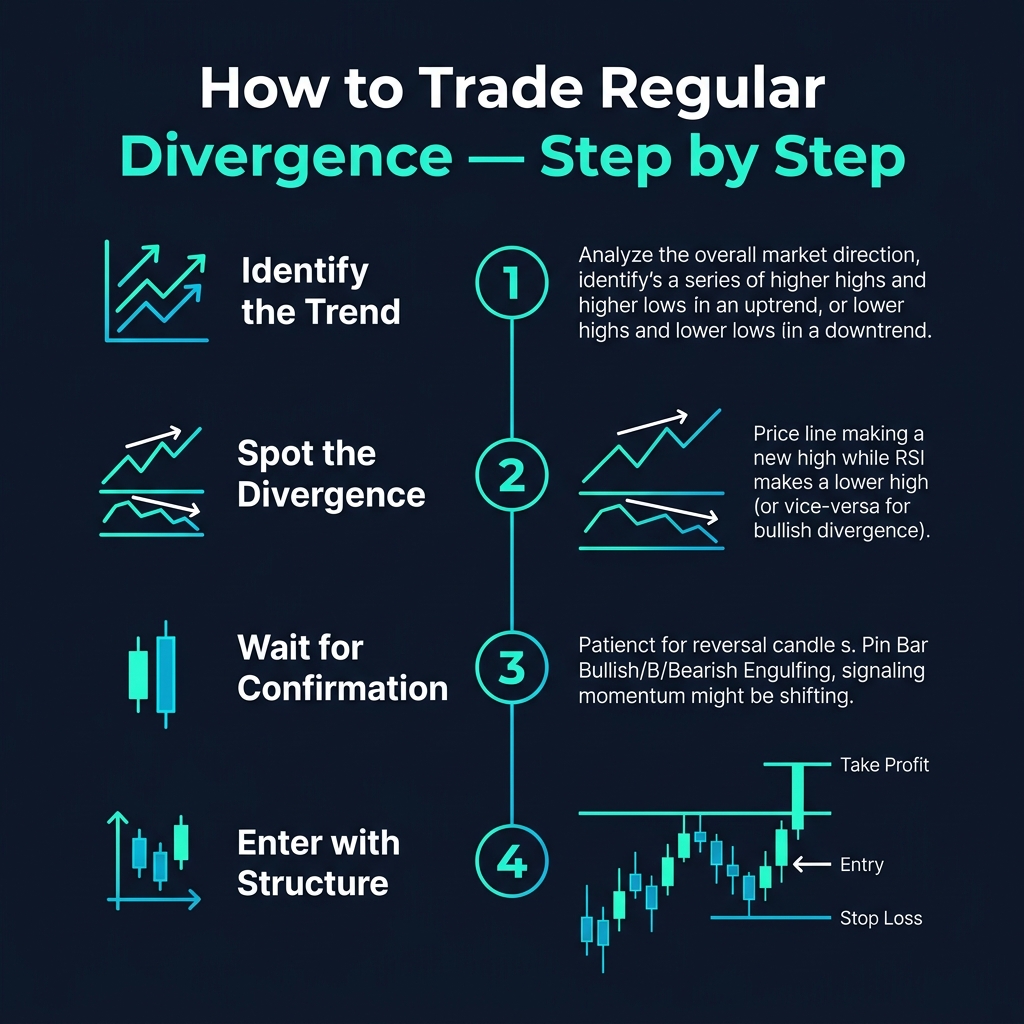
Step 1: Confirm There's an Active Trend
Divergence only works at the end of trends. If the market is chopping sideways, any divergence you see is noise. Use a 50 EMA or higher timeframe structure to confirm the trend.
Step 2: Spot the Divergence
Compare the last two significant highs (for bearish) or lows (for bullish) on price against the corresponding RSI peaks or troughs. Draw a line connecting them. If they slope in opposite directions — you have divergence.
Which indicator? RSI (14) is the most reliable for divergence. MACD works well too. Avoid mixing multiple oscillators — pick one and master it.
Step 3: Wait for Confirmation
This is where most traders fail. They see divergence and immediately enter. Don't. Wait for:
- A reversal candlestick (engulfing, pin bar, morning/evening star)
- A break of short-term structure (price breaking the last swing high/low)
- A move back through a key support/resistance level
Step 4: Enter with a Plan
- Entry: After confirmation candle closes
- Stop loss: Below the recent swing low (bullish) or above swing high (bearish)
- Target: Previous structure level, or 1:2 minimum risk-reward
Real trade example — Bullish divergence on EUR/USD H4:
- Price makes lower low at 1.0780, RSI shows higher low (32 vs previous 25)
- Bullish engulfing candle forms at support
- Entry: 1.0795 | Stop: 1.0760 (35 pips) | Target: 1.0870 (75 pips)
- Risk-Reward: 1:2.1 ✅
The Traps — When Divergence Lies to You
Divergence is powerful but it's not perfect. Here are the situations where it will get you burned:
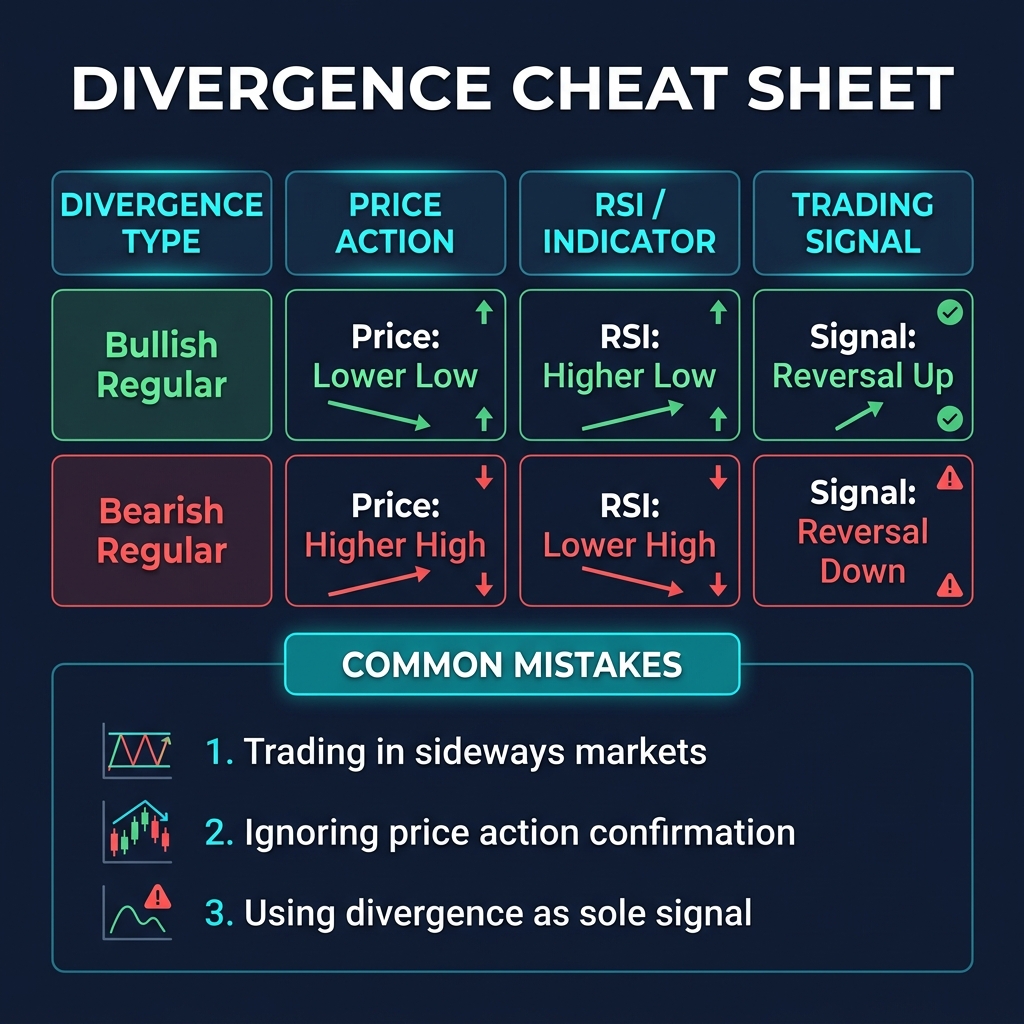
Trap #1: Divergence in a Ranging Market
In a sideways market, RSI bounces between 40–60 constantly. You'll see "divergence" everywhere — and none of it means anything. Rule: only look for divergence after a sustained trend.
Trap #2: Trading Divergence Against a Strong Trend
A strong trend can show divergence for days or even weeks before actually reversing. If EUR/USD is in a monster uptrend driven by rate differentials, bearish divergence on H1 might just get steamrolled. Always check the higher timeframe trend first.
Trap #3: Using Divergence as Your Only Signal
Divergence is a clue, not a conviction. It raises your awareness that something might shift — but it needs confluence. Combine with support/resistance, candlestick patterns, or trendline breaks.
Quick Recap
- Regular divergence signals a potential reversal — momentum is fading before price turns
- Bullish: price makes lower low, RSI makes higher low → potential reversal up
- Bearish: price makes higher high, RSI makes lower high → potential reversal down
- Never trade divergence alone — always wait for confirmation
- Divergence works best at the end of extended trends, not in ranges
🎯 Your Action Step
Open your EUR/USD or GBP/USD H4 chart on TradingView. Add the RSI indicator (14 period). Scroll back through the last 30 days and find at least one example of bullish divergence and one example of bearish divergence. Draw lines connecting the highs/lows on both price and RSI. Did the reversal happen? How many candles after the divergence did price actually turn? Write down your observations.