Every Single Candle Tells a Story
A candlestick isn't just a colorful bar on your screen. It's a compressed battle report between buyers and sellers. The body tells you who won. The wicks tell you how hard the fight was. And the size of each tells you how decisive the victory was.
Learn to read a candlestick and you'll never look at a chart the same way again.
The Anatomy of a Candlestick
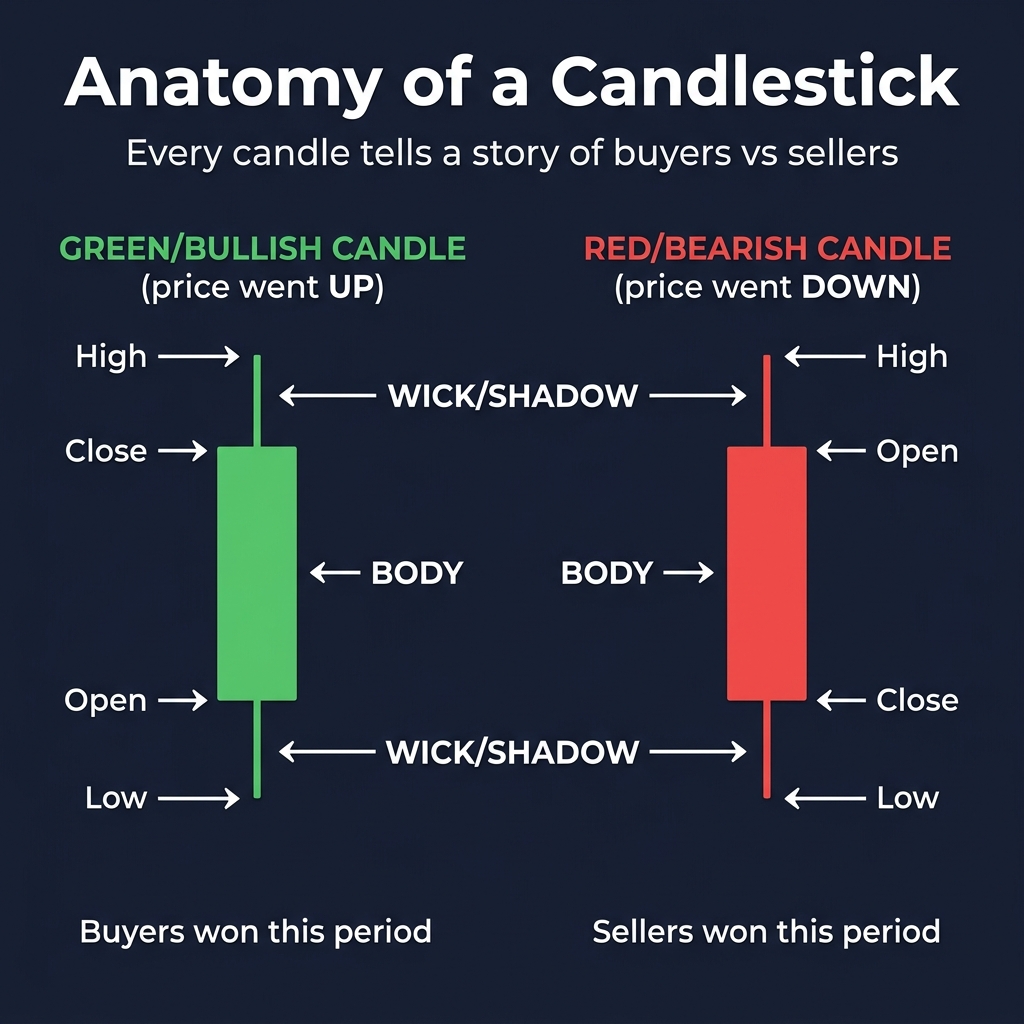
Every candlestick has four data points:
- Open — Where price started when the period began
- Close — Where price ended when the period finished
- High — The highest price reached during the period
- Low — The lowest price reached during the period
The Body
The thick, colored rectangle. If close > open, the candle is green/bullish (buyers won). If close < open, the candle is red/bearish (sellers won).
Big body = strong conviction. Small body = indecision.
The Wicks (Shadows)
The thin lines extending above and below the body. They show the rejected prices — areas where price went but couldn't stay.
Long upper wick = sellers pushed price back down → selling pressure
Long lower wick = buyers pushed price back up → buying pressure
No wick = price moved in one direction without resistance → strong momentum
Reading Candles Like a Pro
| Candle Shape | What It Means | Signal |
|---|---|---|
| Large green body, no wicks | Buyers completely dominated | Strong bullish momentum |
| Large red body, no wicks | Sellers completely dominated | Strong bearish momentum |
| Small body, long wicks both sides | Neither side won → indecision | Doji / Spinning Top (reversal signal) |
| Small body at top, long lower wick | Sellers tried but buyers recovered | Hammer (potential bullish reversal) |
| Small body at bottom, long upper wick | Buyers tried but sellers rejected | Shooting Star (potential bearish reversal) |
Key Candlestick Patterns to Know
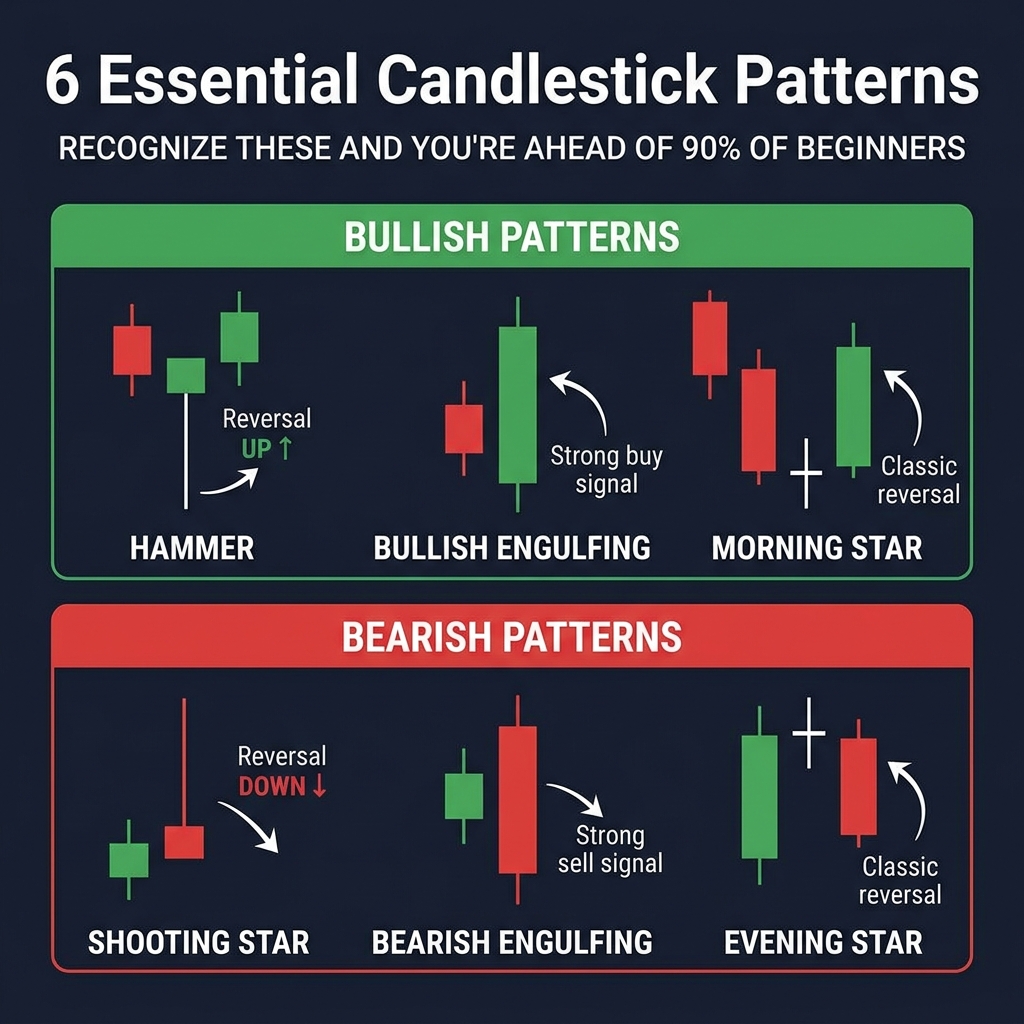
Bullish Patterns (Price May Go Up)
- Hammer: Small body at the top, long lower wick. Appears after a downtrend. Signals buyers are stepping in.
- Bullish Engulfing: A large green candle completely "engulfs" the previous red candle. Strong reversal signal.
- Morning Star: Three-candle pattern — red candle → small body → green candle. Classic reversal.
Bearish Patterns (Price May Go Down)
- Shooting Star: Small body at the bottom, long upper wick. Appears after an uptrend. Signals sellers are pushing back.
- Bearish Engulfing: A large red candle engulfs the previous green candle. Strong reversal signal.
- Evening Star: Mirror of Morning Star — green → small body → red. Reversal warning.
Indecision Patterns
- Doji: Open and close are nearly identical — the body is just a line. Perfect indecision. The fight was a draw.
- Spinning Top: Small body with wicks on both sides. Neither buyers nor sellers gained ground.
⚠️ Important: A single candlestick pattern is a clue, not a guarantee. Always confirm with support/resistance levels and the broader trend. A hammer at a key support level is much more powerful than a random hammer in the middle of nowhere.
Quick Recap
- ✅ Each candlestick shows Open, High, Low, Close
- ✅ Body = who won (buyers or sellers). Wicks = rejected prices
- ✅ Big body = strong conviction. Small body = indecision.
- ✅ Key patterns: Hammer, Engulfing, Doji, Shooting Star
- ✅ Always confirm patterns with support/resistance and trend context