The Art of Reading a Naked Chart
What if you could trade profitably with nothing on your chart except candles and a few lines? No RSI, no MACD, no moving averages, no indicators at all.
This is price action trading — the method used by over 65% of professional short-term traders. Instead of relying on indicators that tell you what already happened, price action reads the market as it unfolds.
Everything you've learned in this level — support/resistance, trend lines, candlestick patterns — comes together right here. Price action is not a new concept. It's the synthesis of everything.
Why Price Action Beats Indicator Overload
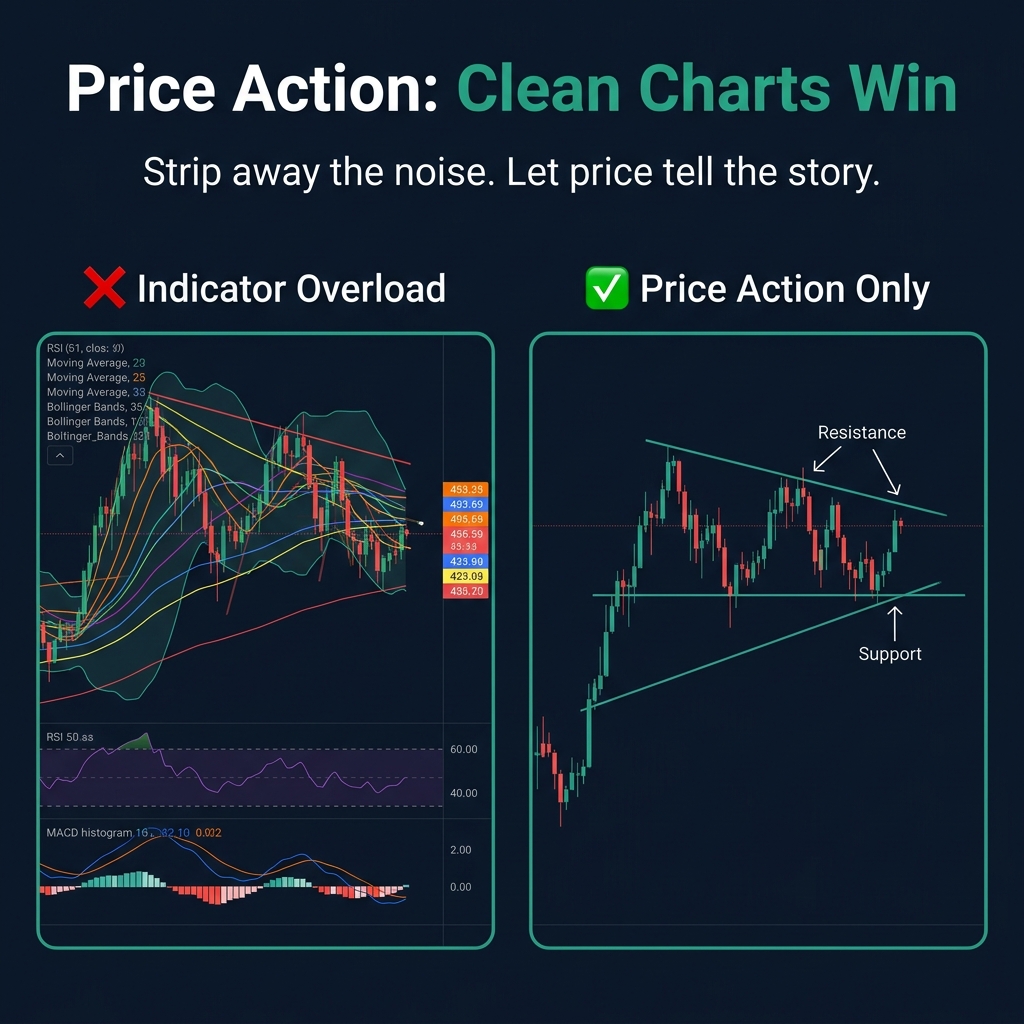
Here's the fundamental problem with indicators: they're all derived from price. Every moving average, every RSI, every MACD — they all calculate something from the price data you're already looking at. They're lagging mirrors, not crystal balls.
| Indicators | Price Action |
|---|---|
| Lagging — show what already happened | Leading — shows what's happening NOW |
| Generate conflicting signals | One source of truth — the price itself |
| Create analysis paralysis | Clean, simple decisions |
| Work poorly in all conditions | Adapts to trends, ranges, and volatility |
🧠 Key principle: Price is the only indicator that never lags. Everything else is secondary.
This doesn't mean indicators are useless. Many successful traders use 1-2 indicators for confirmation. But the decision starts with price — always.
The 3 Core Price Action Strategies
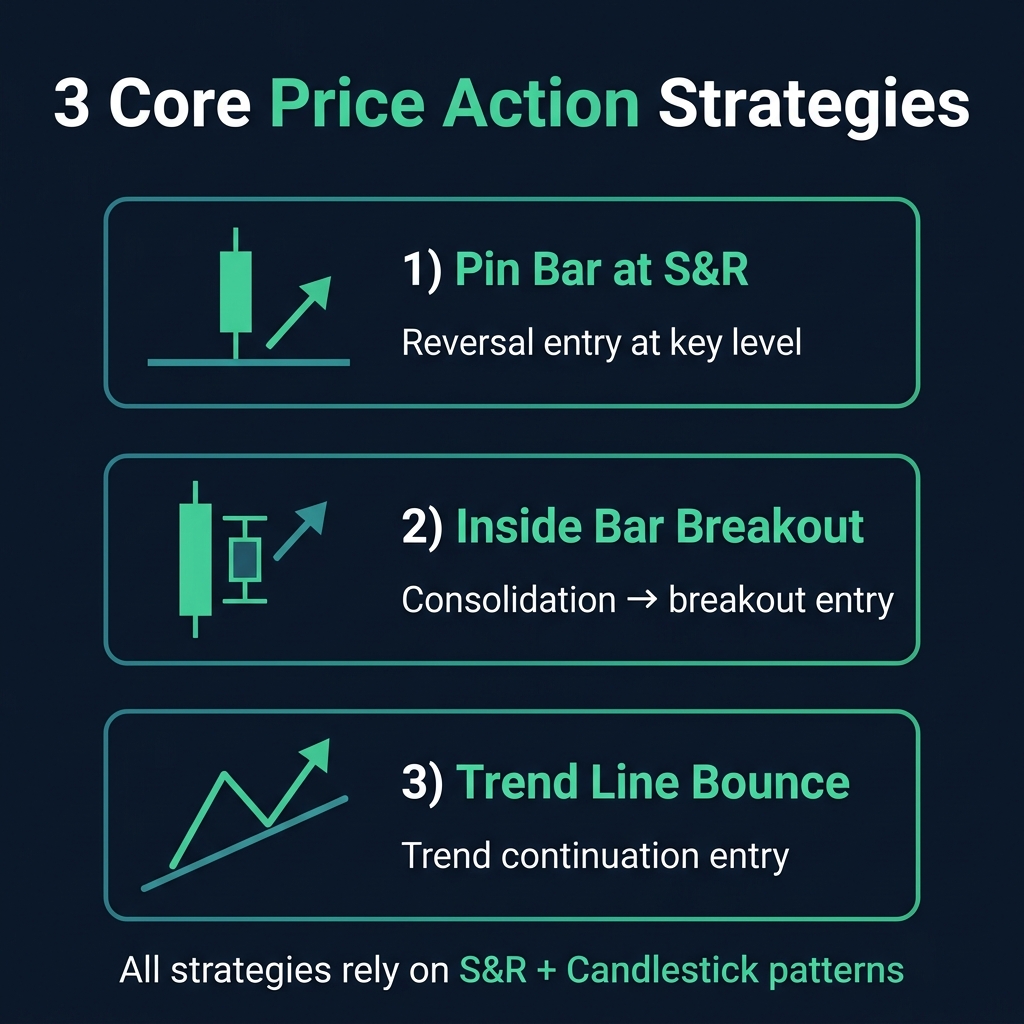
Strategy 1: Pin Bar at Key Level
The pin bar (a hammer or shooting star) appearing at a major S&R level is the bread and butter of price action trading.
- Setup: Price reaches a key support/resistance zone
- Signal: A pin bar forms — long wick pointing into the level (rejection)
- Entry: After the next candle confirms the direction
- Stop loss: Beyond the pin bar's wick (beyond the key level)
Strategy 2: Inside Bar Breakout
An inside bar is a candle whose entire range (high to low) fits within the previous candle. It represents consolidation — the market is compressing before a move.
- Setup: A large "mother" candle followed by one or more small candles inside its range
- Signal: Price breaks above the mother candle's high (bullish) or below its low (bearish)
- Entry: On the breakout candle's close
- Stop loss: On the opposite side of the mother candle
Strategy 3: Trend Line Bounce
In a trending market, the trend line acts as dynamic support (uptrend) or resistance (downtrend).
- Setup: Price pulls back to a valid trend line
- Signal: A bullish candle forms at the trend line (confirms the bounce)
- Entry: Above the bounce candle's high
- Stop loss: Below the trend line
The Price Action Checklist
Before every trade, run through this mental checklist:
- ✅ What is the trend? — Am I trading with or against it?
- ✅ Is there a key level nearby? — S&R, trend line, psychological level?
- ✅ Is there a candlestick signal? — Pin bar, engulfing, doji at the level?
- ✅ Is there confirmation? — Does the next candle support my bias?
- ✅ Is the R:R worth it? — At least 1:2 risk-to-reward?
If you can answer yes to all five, you have a high-probability price action trade.
Quick Recap
- ✅ Price action = trading from the raw price chart, no indicators needed
- ✅ Price is the only leading indicator — everything else lags
- ✅ Three core strategies: Pin Bar at S&R, Inside Bar Breakout, Trend Line Bounce
- ✅ Always combine key level + candlestick pattern + confirmation
- ✅ Clean charts = clear thinking = better trades
🎯 Your Action Step
Remove every indicator from your chart. Yes, all of them. Now look at a Daily EUR/USD chart with just candles and your S&R zones. Find 2 pin bar setups at key levels from the last 3 months. Would you have traded them? What was the result? This exercise proves that price alone gives you everything you need.