The Levels That Move Markets
Have you ever wondered how floor traders at major banks and hedge funds map their trading day before the market even opens? They use pivot points — a mathematical framework that turns yesterday's price action into today's roadmap of support and resistance levels.
Unlike hand-drawn support and resistance (which is subjective), pivot points are calculated from exact data. Everyone looking at the same chart gets the same levels. This makes them a self-fulfilling prophecy — and that's exactly why they work.
What Are Pivot Points?
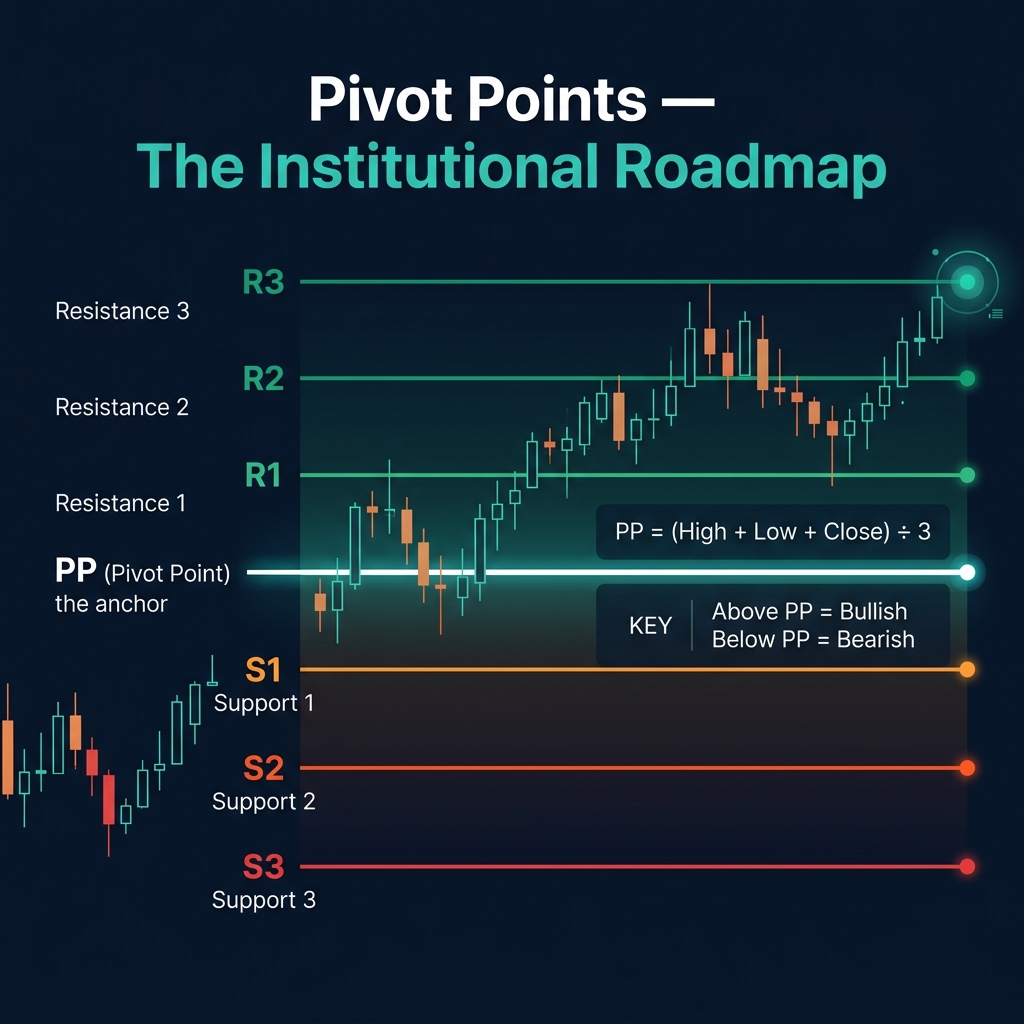
A pivot point (PP) is the average of the previous session's High, Low, and Close:
PP = (High + Low + Close) ÷ 3
From this central anchor, a set of support levels (S1, S2, S3) and resistance levels (R1, R2, R3) are calculated. These levels give you a complete map of where price is likely to pause, reverse, or accelerate during the session.
The Formula Set
| Level | Formula |
|---|---|
| R3 | High + 2 × (PP − Low) |
| R2 | PP + (High − Low) |
| R1 | (2 × PP) − Low |
| PP | (High + Low + Close) ÷ 3 |
| S1 | (2 × PP) − High |
| S2 | PP − (High − Low) |
| S3 | Low − 2 × (High − PP) |
💡 You don't need to calculate these manually. Every trading platform has a built-in pivot point indicator. The formulas are shown so you understand what the levels represent.
Why Pivot Points Work
Three reasons make pivot points uniquely powerful:
- Objective: No subjectivity — everyone gets the same levels from the same data
- Self-fulfilling: Because thousands of traders watch the same levels, price reacts to them — creating real support and resistance
- Institutional usage: Banks, hedge funds, and algorithmic traders all use pivot points. When institutional money watches a level, retail traders benefit from following
The Daily Bias Signal
- Price opens above PP → Bullish bias for the day → Look for longs
- Price opens below PP → Bearish bias for the day → Look for shorts
- Price hovering around PP → Indecision → Wait for a clear break
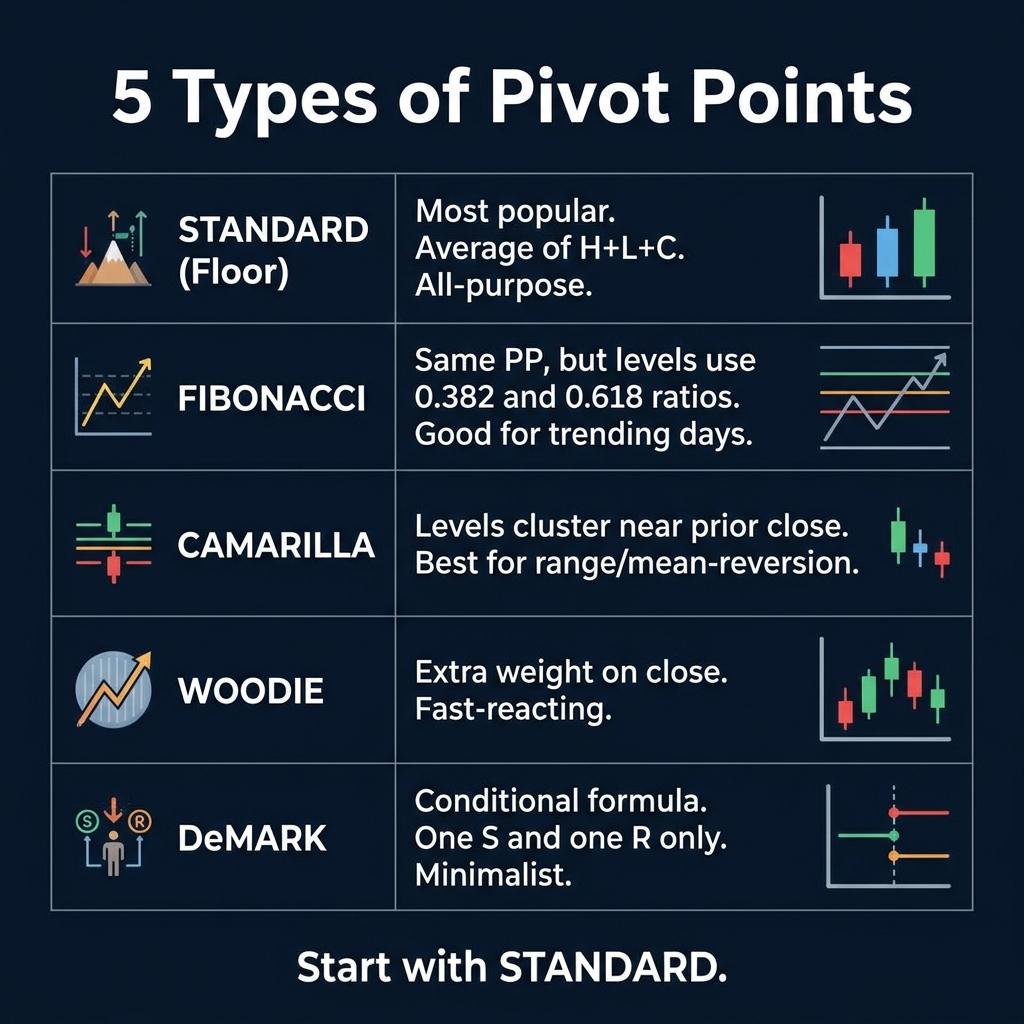
Types of Pivot Points
| Type | Key Feature | Best For |
|---|---|---|
| Standard (Floor) | Average of H+L+C — most widely used | All-purpose intraday map |
| Fibonacci | Same PP, but levels at 0.382 and 0.618 of range | Trending days |
| Camarilla | Levels cluster near prior close | Range/mean-reversion days |
| Woodie | Extra weight on close price | Fast-reacting day bias |
| DeMark | Conditional formula, one S and one R | Minimalist approach |
🎯 Start with Standard (Floor) pivots. They're what most institutions use, they're on every platform, and they give you all the information you need.
Key Levels and What They Mean
| Level | What Happens Here |
|---|---|
| R1 / S1 | First test levels — price reaches here on most normal days |
| R2 / S2 | Extended move levels — only reached when the day has strong momentum |
| R3 / S3 | Extreme levels — rarely reached, signals possible overextension and reversal |
Practical insight: On a typical trading day, price will test R1 or S1 and then reverse. If it breaks through R1, the next target is R2. If it reaches R3, expect a mean-reversion pullback.
Quick Recap
- ✅ Pivot Point (PP) = (High + Low + Close) ÷ 3 — the daily anchor
- ✅ Above PP = bullish bias. Below PP = bearish bias
- ✅ R1/S1 = first target. R2/S2 = extended. R3/S3 = extreme levels
- ✅ Standard pivots are the most widely used — start here
- ✅ Pivot points are objective, institutional, and self-fulfilling
- ✅ Every platform has a built-in pivot point indicator — no manual calculation needed
🎯 Your Action Step
Add the "Pivot Points Standard" indicator to your EUR/USD H1 chart on TradingView. Set it to Daily timeframe. Now observe how today's price interacts with PP, R1, and S1. Does price bounce at these levels? Does it break through with momentum? Start noticing the patterns — this awareness will become your edge.