The Biggest Edge You're Probably Not Using
You open the H1 chart. You see a clear support level, a bullish candlestick pattern, and RSI bouncing from oversold. Everything screams "buy." You enter long — and get stopped out within hours. Why? Because the Daily chart was in a massive downtrend, and your "support" on H1 was nothing more than a brief pause before the next leg down.
This happens when you trade with tunnel vision — looking at only one timeframe. Multi-timeframe analysis (MTF) fixes this by giving you the complete picture: the higher timeframe shows the direction, the middle timeframe shows the setup, and the lower timeframe gives you the precise entry.
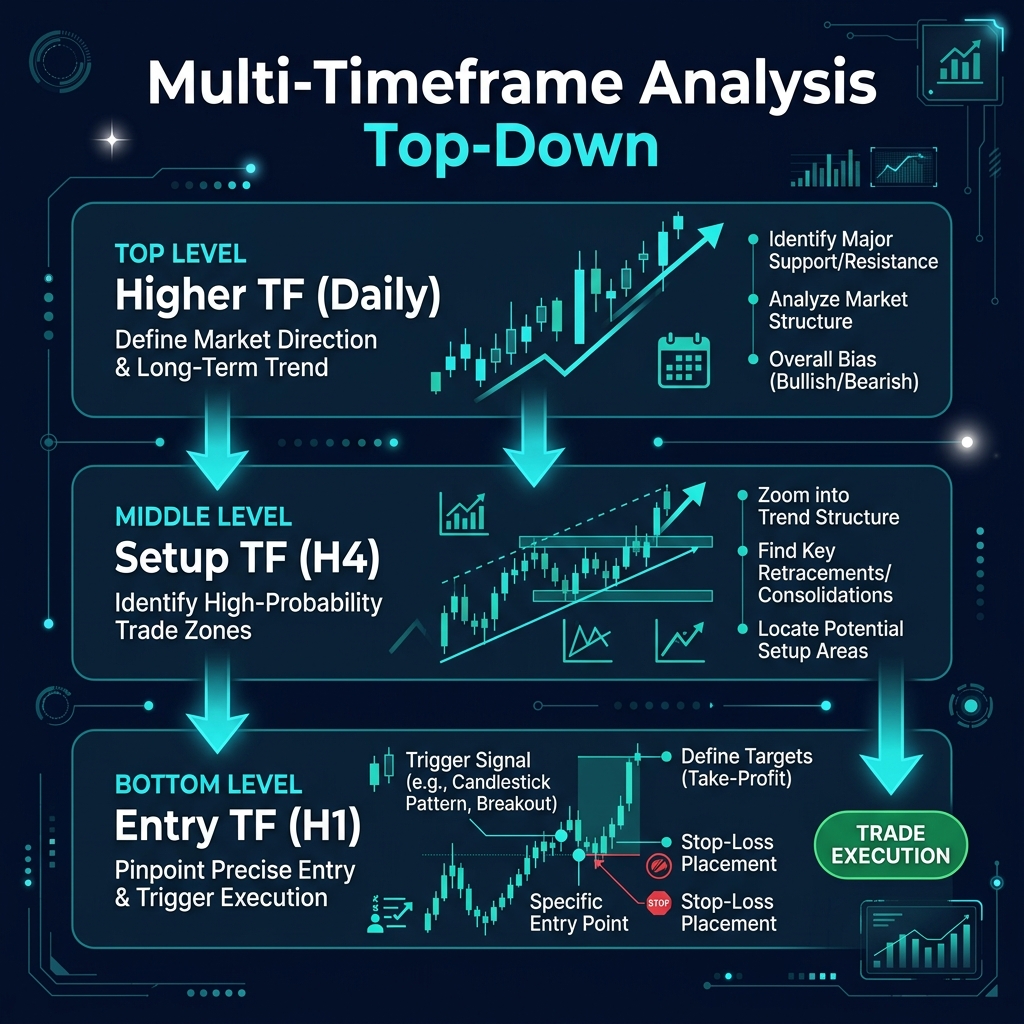
The Three-Timeframe Framework
Timeframe 1: The Direction Filter (Higher TF)
This is your compass. It tells you which direction to trade — and which direction to avoid. You never fight this timeframe.
- Is the trend up, down, or sideways?
- Where are the major S/R zones?
- If the higher TF is bearish, you only look for short setups on the middle and lower TFs
Timeframe 2: The Setup Identifier (Middle TF)
This is where you find your trade opportunities. You're looking for:
- Pullbacks within the higher TF trend
- Key support/resistance levels
- Divergence signals
- Chart patterns (flags, triangles, H&S)
Timeframe 3: The Entry Trigger (Lower TF)
This is your sniper scope. Once the higher TF shows direction and the middle TF shows a setup, you drop to the lower TF for a precise entry with a tight stop loss.
- Confirmation candles (engulfing, pin bar)
- Structure breaks on the lower TF
- Exact entry price, stop loss, and initial target
The Golden Rule: Only Trade When All Three Agree
The magic of MTF analysis is alignment. Your trade probability skyrockets when all three timeframes point in the same direction:
| Higher TF | Middle TF | Lower TF | Action |
|---|---|---|---|
| Uptrend ↑ | Pullback to support ↓ | Bullish signal ↑ | ✅ BUY — all aligned |
| Downtrend ↓ | Rally to resistance ↑ | Bearish signal ↓ | ✅ SELL — all aligned |
| Uptrend ↑ | At resistance ↑ | Bearish signal ↓ | ❌ SKIP — conflicting |
| Ranging ↔ | Any | Any | ⚠️ Range strategies only |
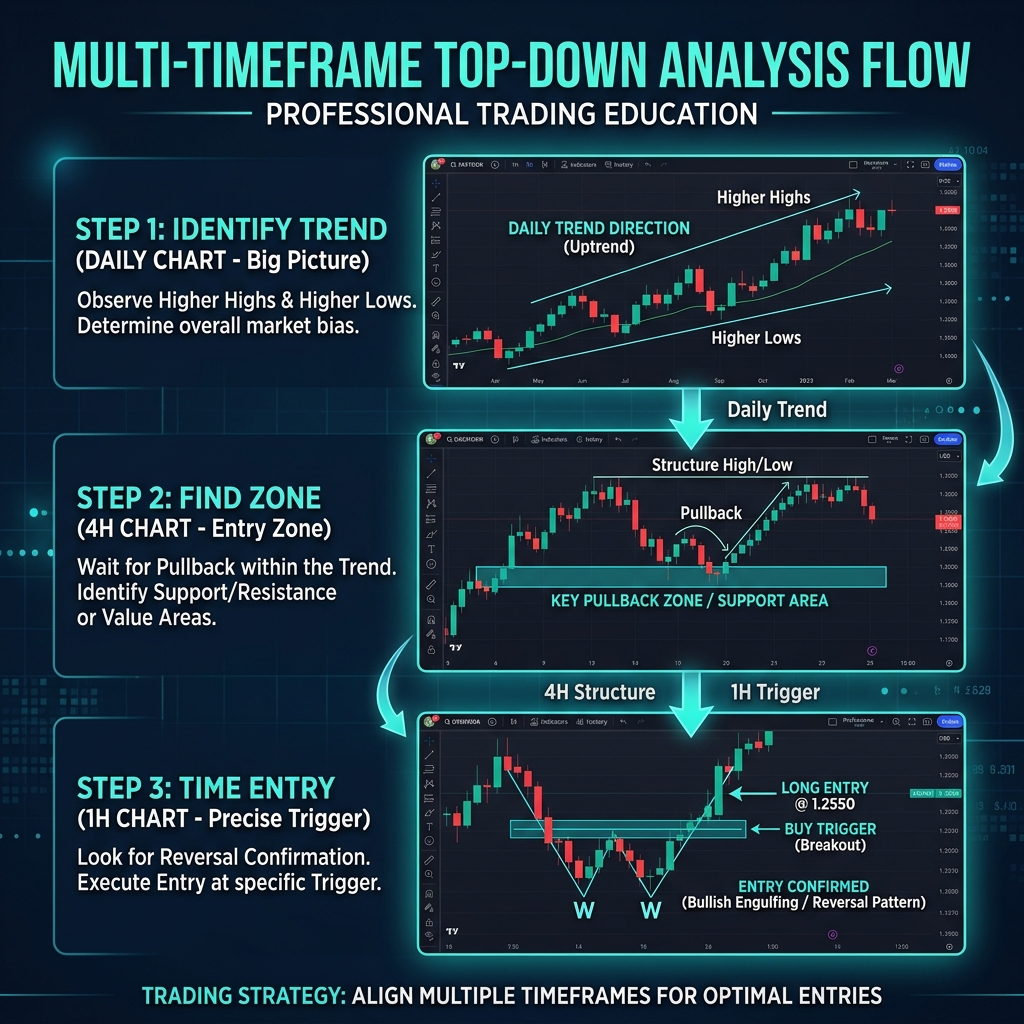
How to Do MTF Analysis — Step by Step
- Open the higher TF first. Determine the overall trend. Mark major S/R zones. Decide: are you looking for buys, sells, or neither?
- Drop to the middle TF. Find setups that align with the higher TF direction. Mark pullback zones, patterns, or divergence.
- Drop to the lower TF. Wait for a precise entry trigger at your setup zone. Enter with your plan: entry, SL, TP already defined.
- Manage the trade on the middle TF. Don't manage on the lower TF — you'll overtrade. Check the middle TF for your exit signals.
Real example — Buying EUR/USD using MTF:
- Daily (direction): Clear uptrend — price above 50 EMA, making HH/HL
- H4 (setup): Pullback to 1.0870 — previous resistance now support, 38.2% Fibonacci retracement
- H1 (entry): Bullish engulfing at 1.0875, RSI bouncing from 35
- Entry: 1.0880 | Stop: 1.0845 (35 pips below H4 support) | Target: 1.0965 (85 pips)
- R:R = 1:2.4 ✅
Common MTF Mistakes
- Using timeframes too close together: H1 and H2 show essentially the same thing. You need separation (4-6x between each level).
- Analysis paralysis: Looking at 5+ timeframes and seeing conflicting signals everywhere. Stick to exactly 3.
- Letting the lower TF override the higher TF: If the Daily is bearish, that perfect-looking buy setup on M15 is a trap. The higher TF always wins.
- Managing trades on the entry TF: You entered on H1, so you keep checking H1 and exit too early. Manage on the setup TF (H4) instead.
Quick Recap
- MTF analysis uses 3 timeframes: Direction → Setup → Entry
- Only trade when all three timeframes agree
- The higher TF is your compass — never fight it
- Each timeframe should be 4-6x the one below it
- Enter on the lower TF, manage on the middle TF, respect the higher TF
🎯 Your Action Step
Open EUR/USD on three TFs: Daily, H4, H1. Start with the Daily — what's the trend? Then zoom into H4 — is there a pullback or setup forming? Finally check H1 — is there an entry signal? Write down your analysis: "Daily says [direction], H4 shows [setup], H1 gives [signal]." Do this for 5 consecutive trading days to build the habit.