The Two Signals Every Trader Knows
If there were ever a "buy" and "sell" button in technical analysis, it would be the Golden Cross and Death Cross. These two moving average crossover patterns are among the most recognized signals in all of trading — used by forex traders, stock traders, and crypto traders alike.
The concept is simple: when a short-term moving average crosses above a long-term moving average, bulls are taking over. When it crosses below, bears are in control. But as with everything in trading, the devil is in the details.
Golden Cross vs Death Cross
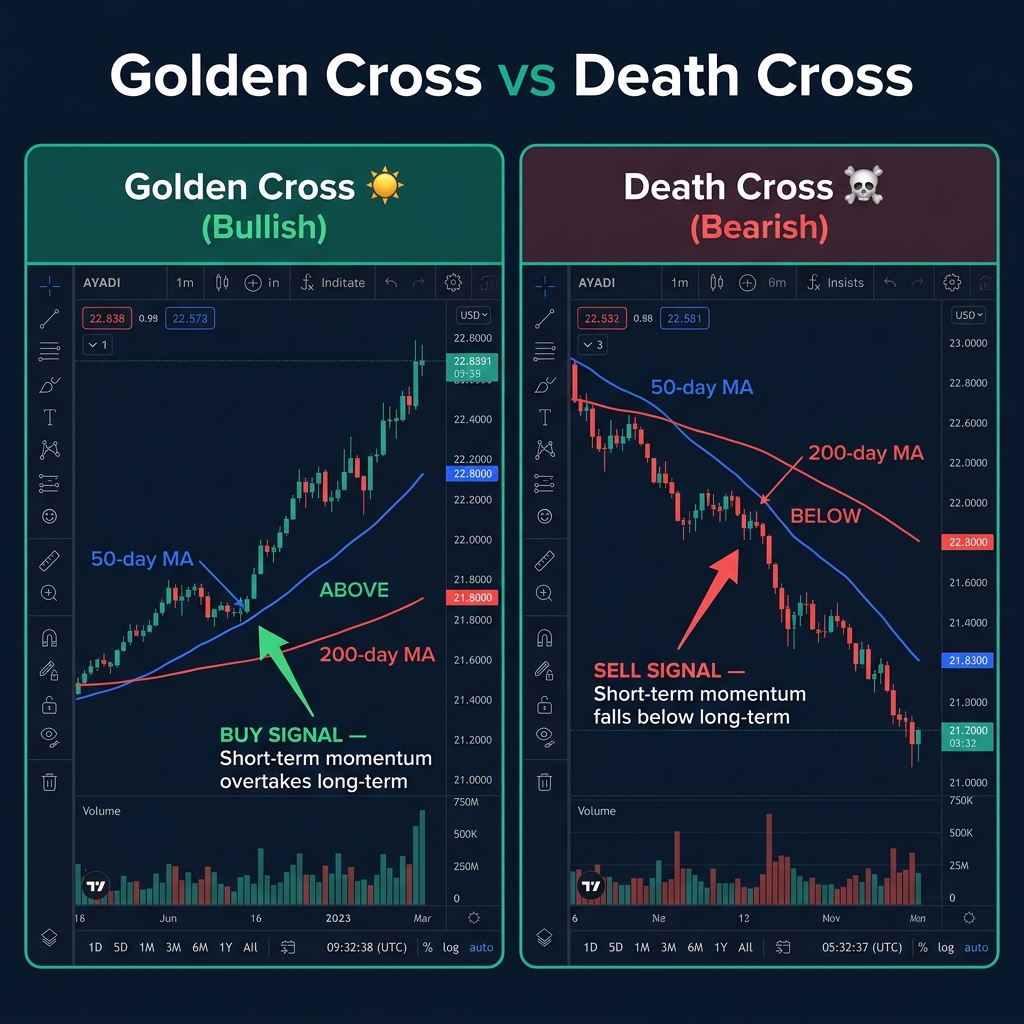
Golden Cross ☀️ (Bullish Signal)
A Golden Cross occurs when the 50-period MA crosses ABOVE the 200-period MA. This signals that recent price momentum (50 MA) has overtaken the long-term trend (200 MA) — the market is turning bullish.
Three phases of a Golden Cross:
- Downtrend: 50 MA is below 200 MA — the market has been declining
- Crossover: 50 MA rises and crosses above 200 MA — momentum shifts
- Confirmation: Price continues above both MAs — the uptrend is confirmed
Death Cross 💀 (Bearish Signal)
A Death Cross occurs when the 50-period MA crosses BELOW the 200-period MA. This signals that recent momentum has fallen below the long-term trend — the market is turning bearish.
Three phases of a Death Cross:
- Uptrend: 50 MA is above 200 MA — the market has been rising
- Crossover: 50 MA drops and crosses below 200 MA — momentum weakens
- Confirmation: Price continues below both MAs — the downtrend is confirmed
How to Trade Crossovers Safely
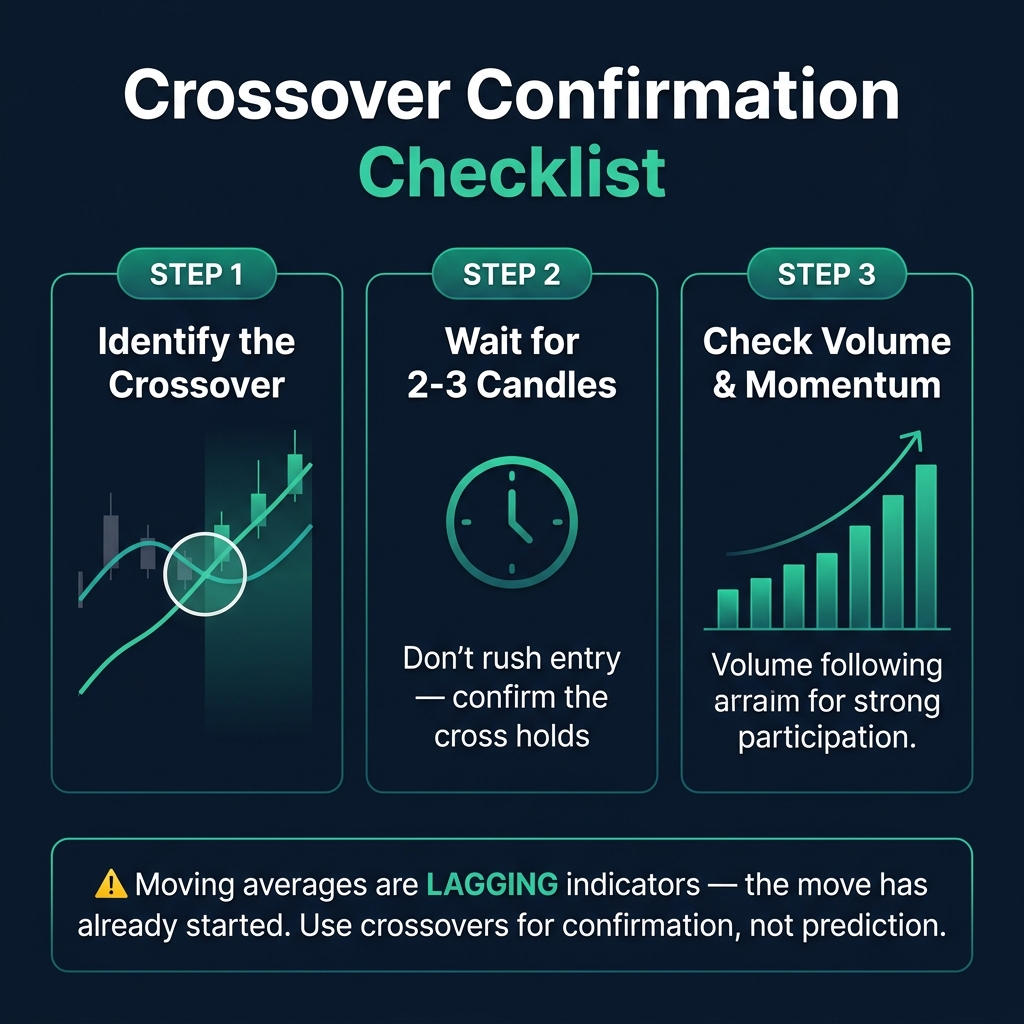
⚠️ Critical warning: Moving averages are lagging indicators. By the time the Golden Cross or Death Cross appears, the move has already started. This means:
- Don't treat crossovers as instant "buy now" or "sell now" signals
- Use them to confirm a trend you've already identified with other tools
- Combine with S&R, candlestick patterns, or Fibonacci for better entries
The Confirmation Checklist
| Step | Action | Why |
|---|---|---|
| 1 | Identify the crossover | Golden Cross = buy bias. Death Cross = sell bias |
| 2 | Wait 2-3 candles | Avoid fakeouts — let the cross prove itself |
| 3 | Check price structure | Is the cross happening at a key S&R level? |
| 4 | Look for a pullback | Enter on a retracement to the MA, not at the cross |
🎯 Pro approach: Use the crossover to set your directional bias. Then use price action (S&R, candlesticks) to find your actual entry. The cross tells you WHICH direction. Other tools tell you WHEN.
Other Useful Crossover Pairs
The 50/200 is the most famous, but traders use other combinations too:
| Crossover Pair | Signal Speed | Best For |
|---|---|---|
| 10 EMA / 20 EMA | Very fast | Day trading, scalping (H1 and below) |
| 20 EMA / 50 SMA | Medium | Swing trading (H4, Daily) |
| 50 SMA / 200 SMA | Slow (Golden/Death) | Position trading, big-picture bias |
Quick Recap
- ✅ Golden Cross = 50 MA crosses ABOVE 200 MA → bullish signal
- ✅ Death Cross = 50 MA crosses BELOW 200 MA → bearish signal
- ✅ Moving averages are lagging — use crossovers for confirmation, not prediction
- ✅ Wait for 2-3 candles after the cross to avoid fakeouts
- ✅ Combine with S&R, Fibonacci, and candlestick patterns for precise entries
🎯 Your Action Step
Add the 50 SMA and 200 SMA to EUR/USD on the Daily chart. Scroll back 6-12 months and find the last Golden Cross and Death Cross. How many pips did the trend travel after each crossover? Was there a fakeout? This exercise shows you the power — and the limitations — of crossover signals.