See Trend AND Momentum in One Indicator
Most indicators show you one thing — either the trend direction OR the momentum. The MACD (Moving Average Convergence Divergence) shows you both at the same time. Created by Gerald Appel in the 1970s, it's become one of the most versatile tools in any trader's arsenal.
The MACD tells you: Is the trend speeding up or slowing down? Are bulls or bears in control? Is a reversal coming? All from a single indicator panel.
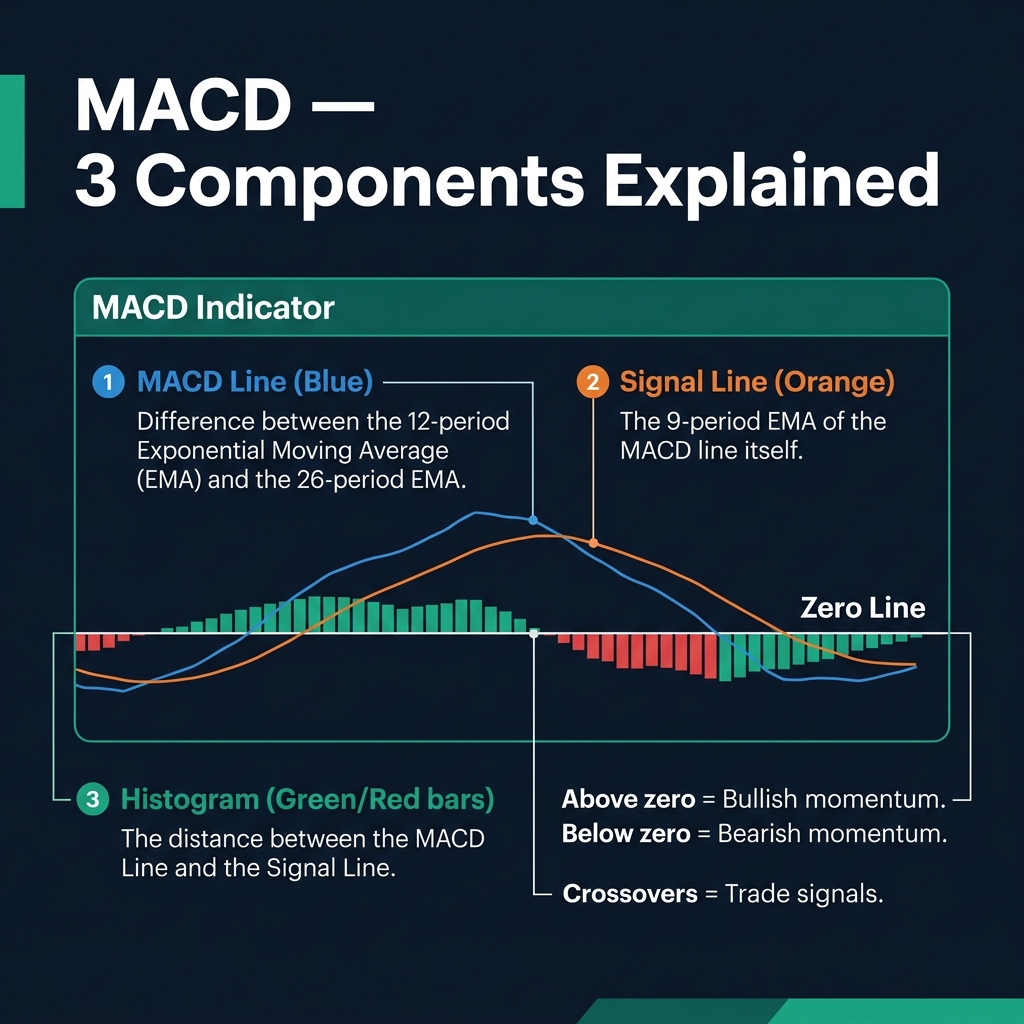
The 3 Components of MACD
| Component | What It Is | What It Tells You |
|---|---|---|
| MACD Line | 12 EMA minus 26 EMA | The difference between short and long-term momentum |
| Signal Line | 9-period EMA of the MACD Line | The trigger for buy/sell signals |
| Histogram | MACD Line minus Signal Line | Visual momentum gauge — growing = momentum increasing |
The zero line is the neutral point. When the MACD is above zero, bullish momentum dominates. Below zero, bearish momentum leads.
3 Ways to Trade the MACD
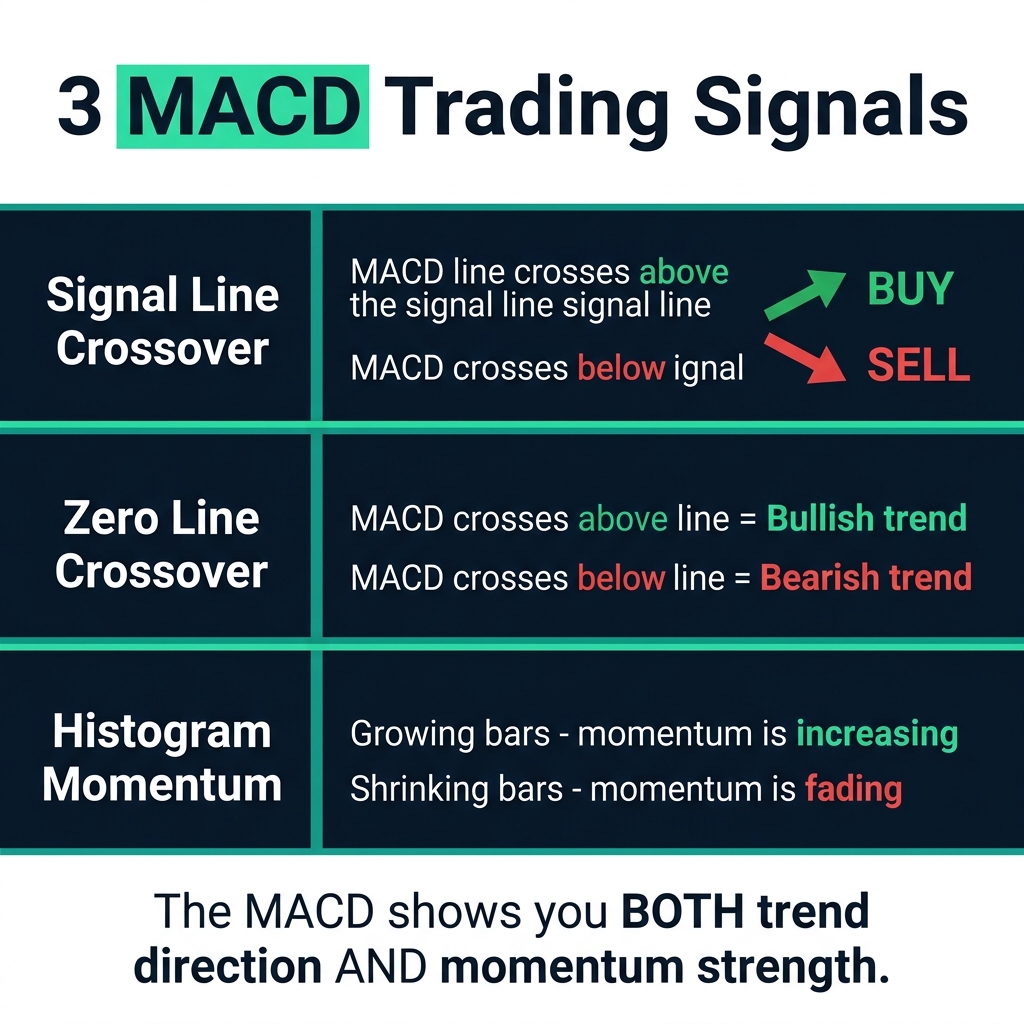
1. Signal Line Crossover
- Buy: MACD line crosses ABOVE signal line → bullish momentum starting
- Sell: MACD line crosses BELOW signal line → bearish momentum starting
- This is the most common MACD signal — simple and effective in trending markets
2. Zero Line Crossover
- MACD crosses above zero: Short-term momentum is now bullish — uptrend confirmed
- MACD crosses below zero: Short-term momentum is bearish — downtrend confirmed
- This is a slower but more reliable signal than the signal line crossover
3. Histogram Analysis
- Growing bars: Momentum is increasing — the trend is strengthening
- Shrinking bars: Momentum is fading — the trend may pause or reverse
- Watch for histogram divergence: price makes new highs but histogram bars are getting smaller = weakening momentum
🎯 Best MACD combo: Use signal line crossovers for entries, histogram for momentum confirmation, and zero line for overall trend direction. All three components work together.
MACD Settings
| Setting | Parameters | Best For |
|---|---|---|
| Standard | 12, 26, 9 | All-purpose — Daily, H4 |
| Fast | 5, 13, 1 | Scalping, day trading |
| Slow | 24, 52, 18 | Swing trading, position trading |
Quick Recap
- ✅ MACD = trend direction + momentum strength in one indicator
- ✅ Three components: MACD Line, Signal Line, Histogram
- ✅ Signal line crossover = most common trade signal
- ✅ Histogram divergence = early warning of trend exhaustion
- ✅ Above zero = bullish. Below zero = bearish
🎯 Your Action Step
Add the MACD (12, 26, 9) to EUR/USD on the Daily chart. Find a signal line crossover that occurred near a key S&R level. Did the trade work? Now look at the histogram — was it growing or shrinking at the time? This teaches you to use all three MACD components together.