The Two Tribes of Indicators
You've now learned a powerful arsenal of technical indicators — RSI, MACD, Stochastic, Bollinger Bands, Moving Averages, and more. But here's a question that separates amateurs from professionals: do you know which type of indicator you're actually using?
Every technical indicator falls into one of two categories: leading or lagging. Understanding this distinction will completely change how you interpret signals — and more importantly, when you trust them.
Leading Indicators — The Crystal Ball
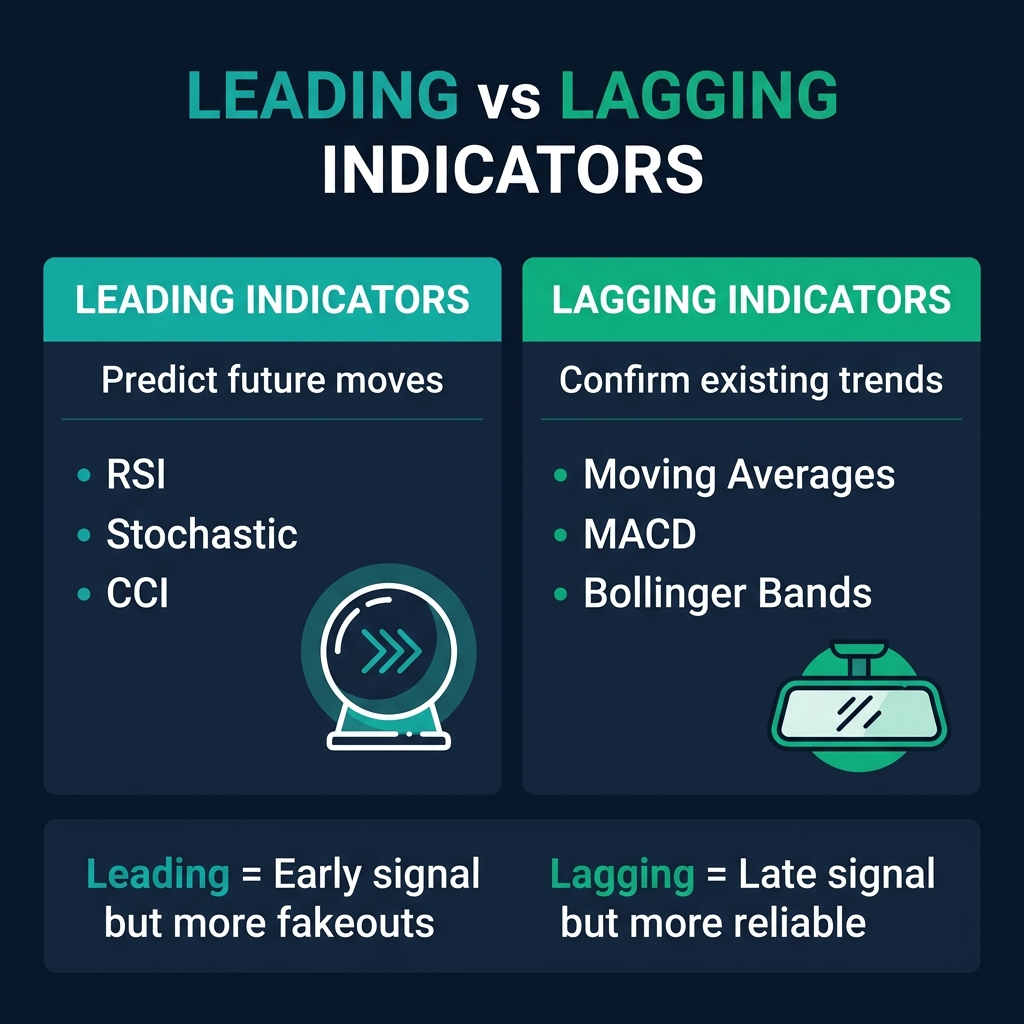
Leading indicators give signals before a new trend or reversal begins. They try to predict what price will do next. Think of them as a weather forecast — useful, but not always right.
Common Leading Indicators
| Indicator | What It Does | Signal Type |
|---|---|---|
| RSI | Measures momentum — overbought/oversold | Reversal warning |
| Stochastic | Compares close to recent range | Reversal warning |
| CCI | Measures price deviation from mean | Extreme readings |
Strengths
- ✅ Get in early — catch trends near the beginning
- ✅ Great for identifying oversold/overbought extremes
- ✅ Work brilliantly in ranging (sideways) markets
Weaknesses
- ❌ Produce more fakeouts and false signals
- ❌ A market can stay "overbought" for weeks in a strong trend
- ❌ Never trade them alone — always need confirmation
💡 Many beginners see RSI hit 70 and immediately sell. But in a strong uptrend, RSI can stay above 70 for weeks. The indicator isn't wrong — you're using it in the wrong market condition.
Lagging Indicators — The Rearview Mirror
Lagging indicators give signals after a trend has already started. They confirm what's happening rather than predict what will happen. Think of them as a GPS that says "you are on the highway" — accurate, but you already knew that.
Common Lagging Indicators
| Indicator | What It Does | Signal Type |
|---|---|---|
| Moving Averages | Smooths price to show trend direction | Trend confirmation |
| MACD | Shows momentum via MA convergence | Trend + momentum |
| Bollinger Bands | Measures volatility around a moving average | Volatility + trend |
Strengths
- ✅ Fewer false signals — you're trading confirmed trends
- ✅ Keep you on the right side of the market
- ✅ Work brilliantly in trending markets
Weaknesses
- ❌ Late entries — you miss the first part of the move
- ❌ Give whipsaw signals in sideways markets
- ❌ By the time you get the signal, a big chunk of profit is gone
The Critical Rule: Match Indicator to Market
This is the most important concept in this entire lesson:
| Market Condition | Best Indicator Type | Examples |
|---|---|---|
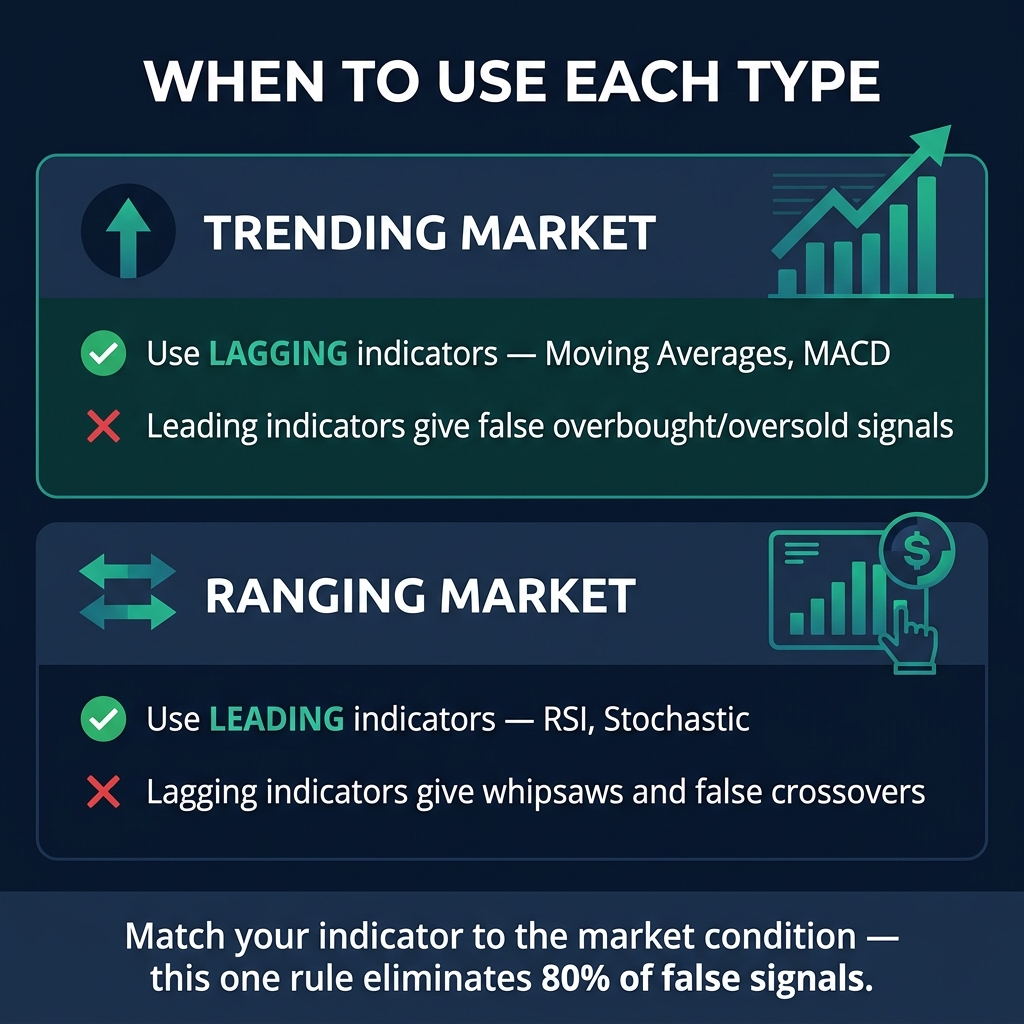
| Trending (clear direction) | Lagging | Moving Averages, MACD |
| Ranging (sideways) | Leading | RSI, Stochastic |
🎯 First identify the market condition (trending or ranging), THEN choose your indicator. Using RSI in a trending market = fakeouts. Using Moving Averages in a range = whipsaws. The indicator isn't broken — you're using the wrong tool for the job.
How to Identify the Market Condition
- ADX above 25 → Market is trending → use lagging indicators
- ADX below 20 → Market is ranging → use leading indicators
- Moving Averages flat? → Range → leading indicators
- Moving Averages sloping? → Trend → lagging indicators
The Best Approach: Combine Both
Professional traders don't choose one type — they use both together:
- Lagging indicator confirms the trend direction (e.g., price above 200 SMA = bullish)
- Leading indicator times the entry within that trend (e.g., RSI pulls back to 40 in an uptrend = buy opportunity)
This is the foundation of what we'll learn in the next lesson — building an indicator stack.
Quick Recap
- ✅ Leading indicators (RSI, Stochastic, CCI) predict — early signals but more fakeouts
- ✅ Lagging indicators (MA, MACD, Bollinger) confirm — reliable but late entries
- ✅ Trending markets → use lagging indicators (MAs, MACD)
- ✅ Ranging markets → use leading indicators (RSI, Stochastic)
- ✅ Best approach: combine both — lagging for direction, leading for timing
🎯 Your Action Step
Pull up EUR/USD on the Daily chart. Add the ADX (14) indicator. Is the ADX above 25 (trending) or below 20 (ranging)? Based on your answer, which type of indicator should you use right now? Add the appropriate tool and check — does its signal make sense in this market condition?