The Most Expensive Lesson in Trading
You see RSI bearish divergence. Price is making higher highs, but RSI is making lower highs. Every textbook says "sell." So you sell. And the market rips 200 pips higher.
Welcome to the indicator trap — the space between what textbooks teach and what actually works in live markets. This lesson will save you from the 5 most common traps that cause traders to lose money even when they're technically right.
Trap #1: The Divergence That Goes Nowhere
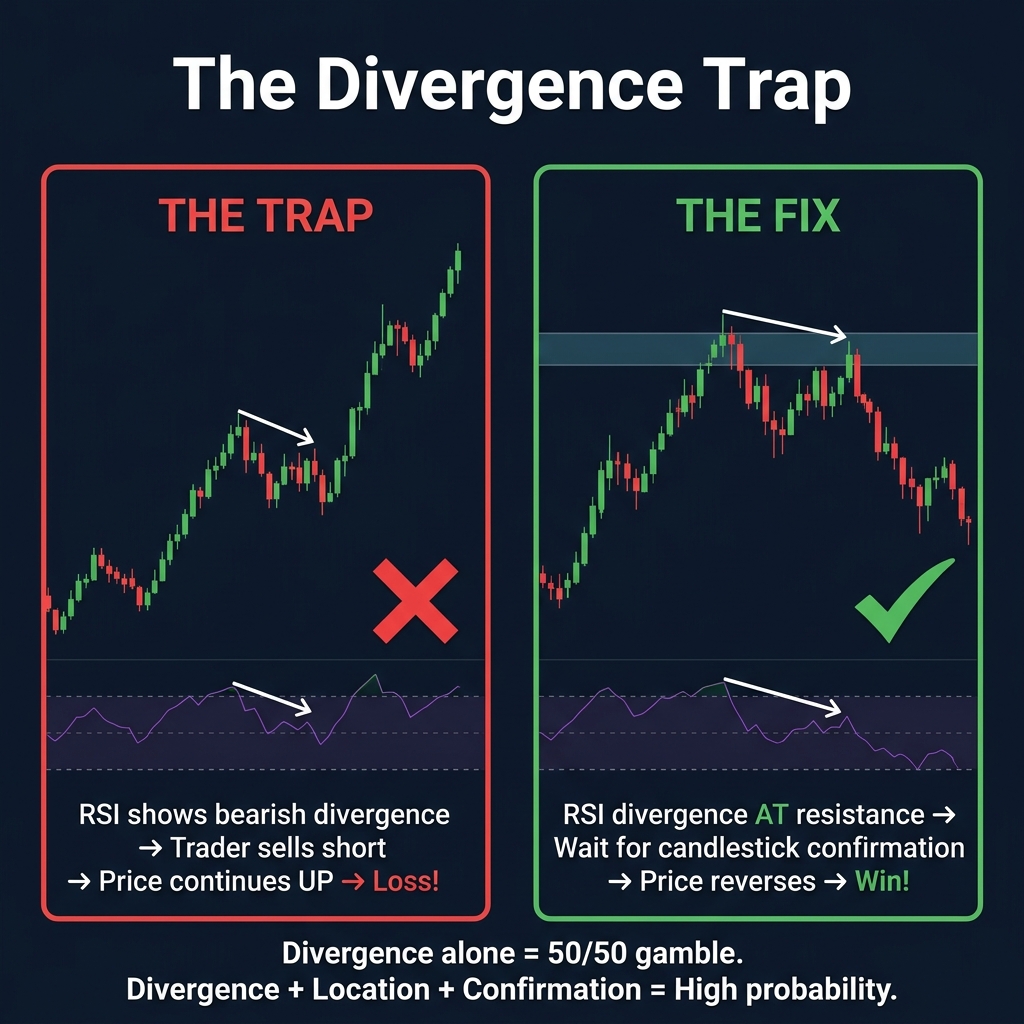
RSI divergence is one of the most powerful signals in trading — but only when used at the right location. Most failed divergence trades happen because the trader spotted the divergence in the middle of a strong trend, with no supporting structure.
The Problem
- Divergence in the middle of a trend → Price often consolidates sideways briefly, then continues the trend. You get stopped out.
- A trend can produce 3, 4, even 5 divergences before actually reversing
- Divergence signals a loss of momentum, not necessarily a reversal
The Fix: Location + Confirmation
- Location: Only trade divergence at a key support/resistance level, Fibonacci zone, or previous swing high/low
- Higher timeframe alignment: Check the Daily chart — is divergence happening against the D1 trend? Then don't trade it
- Candlestick confirmation: Wait for a rejection candle (hammer, engulfing, shooting star) after the divergence forms
💡 The formula: Divergence + Key Level + Candlestick Confirmation = High-probability reversal. Divergence alone = coin flip.
Trap #2: "Overbought" Doesn't Mean "Sell"
This trap catches more beginners than any other. RSI hits 75 in a strong uptrend, and they immediately sell because "it's overbought." Then the price rallies another 300 pips.
The reality: In a strong trend, RSI can stay overbought for weeks. In fact, the RSI staying above 70 is actually a sign of strength, not weakness.
| Situation | What Beginners Think | What Actually Happens |
|---|---|---|
| RSI above 70 in an uptrend | "Overbought! Time to sell!" | Trend is strong — RSI can stay above 70 for weeks |
| RSI below 30 in a downtrend | "Oversold! Time to buy!" | Trend is strong — RSI can stay below 30 for weeks |
| RSI above 70 at resistance | "Sell confirmation!" | ✅ This is the correct interpretation |
The fix: Overbought/oversold only matter near key structural levels. In the middle of a trend, they're meaningless.
Trap #3: Redundant Confirmation (False Confidence)
A trader adds RSI, Stochastic, AND CCI to their chart. All three show "oversold." They think: "Three indicators agree — this is a strong buy signal!" But all three are momentum oscillators — they measure the same thing. Three copies of the same answer is not three confirmations.
How to Avoid It
Each indicator in your stack must measure something different:
- Trend: Moving Average, Ichimoku, ADX
- Momentum: RSI or Stochastic or CCI (pick ONE)
- Volatility: Bollinger Bands or ATR (pick ONE)
⚠️ Real confirmation = 3 different types of indicators agreeing. Fake confirmation = 3 of the same type saying the same thing.
Trap #4: Ignoring Higher Timeframes
You see a beautiful bullish divergence on the M15 chart. RSI is turning up from oversold. Everything looks perfect for a buy. But the Daily chart? Price is crashing through support with a massive bearish engulfing candle.
Your M15 divergence is nothing more than a tiny correction inside a major downtrend. Trading it is like swimming upstream in a river.
The Top-Down Rule
- Daily chart: What's the overall trend? (Your compass)
- H4 chart: Where are the key levels? (Your map)
- H1/M15: What's the entry signal? (Your trigger)
If the lower-timeframe signal contradicts the higher-timeframe trend, skip it. Always.
Trap #5: No Stop Loss on "Sure Thing" Trades
Divergence looks perfect. Location is right. Candlestick confirms. So the trader goes in big — no stop loss, because "this one is a sure thing."
There are no sure things. Even with perfect conditions, divergence trades fail 30-40% of the time. Without a stop loss, one failed trade can wipe out 10 winning trades.
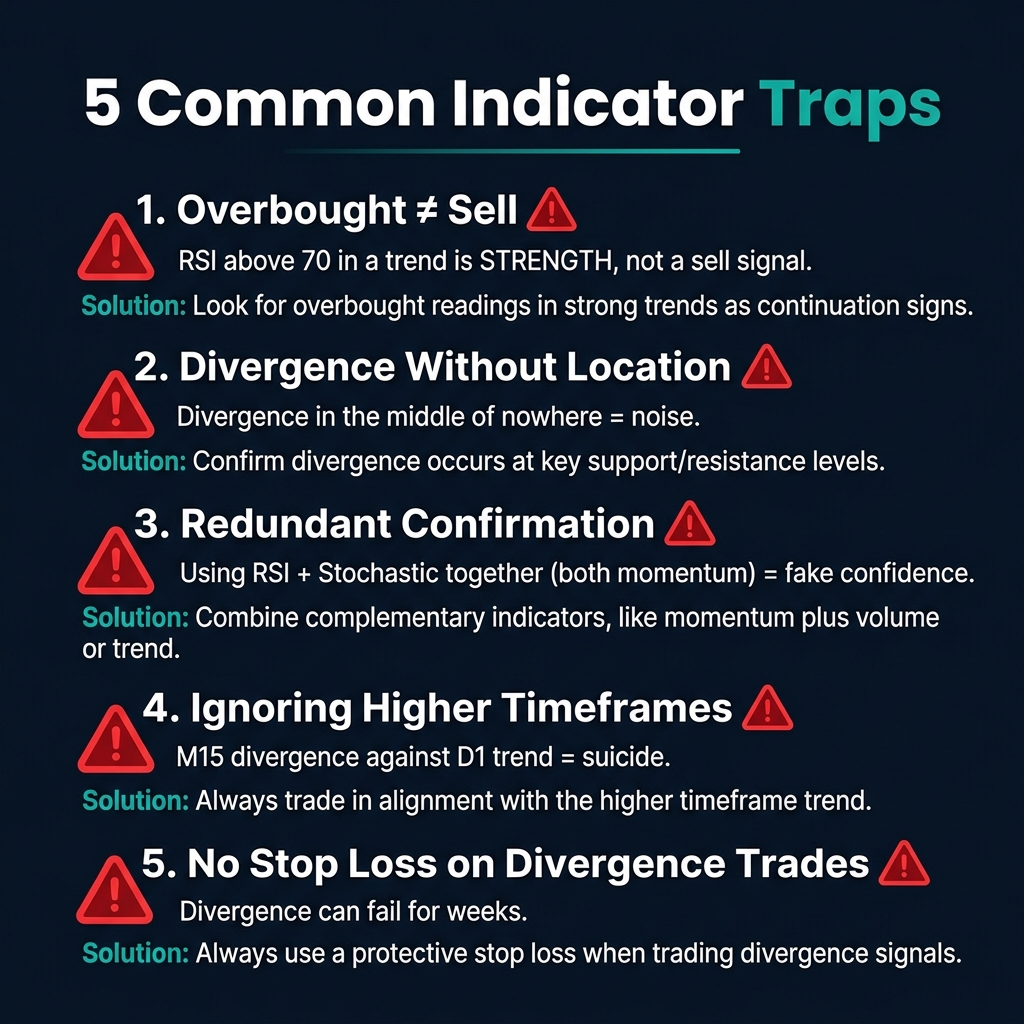
The 5 Traps — Summary
| # | Trap | Fix |
|---|---|---|
| 1 | Divergence without location | Only trade at key S&R, Fibonacci, or swing levels |
| 2 | Overbought = sell | OB/OS only matters at structural levels |
| 3 | Redundant confirmation | Use one indicator per category (trend, momentum, volatility) |
| 4 | Ignoring higher timeframes | Always check D1 trend before trusting M15 signals |
| 5 | No stop loss | Every trade gets a stop — especially "sure things" |
Quick Recap
- ✅ Divergence signals momentum loss, not guaranteed reversal — needs location + confirmation
- ✅ Overbought/oversold is meaningless in a strong trend — only matters at key levels
- ✅ Real confirmation = different indicator types agreeing, not the same type repeated
- ✅ Higher timeframes always win — never trade against the D1 trend
- ✅ Every trade needs a stop loss — there are no "sure things"
🎯 Your Action Step
Open your EUR/USD Daily chart and find 3 RSI divergence signals in the past 6 months. For each one, check: (1) Was it at a key S&R level? (2) Did a candlestick pattern confirm? (3) Did the divergence lead to a real reversal — or just a minor pause? You'll quickly see which divergences "worked" and which were traps.