One Indicator That Does Everything
Most indicators show you one thing — trend, momentum, or support/resistance. The Ichimoku Cloud shows you all three at once. Developed by Japanese journalist Goichi Hosoda in the 1960s (after 30 years of research!), Ichimoku Kinko Hyo translates to "one glance equilibrium chart" — see the whole market situation in a single glance.
It looks intimidating with its five lines and colored cloud, but once you understand each component, it becomes one of the most powerful tools in your toolkit.
The 5 Components
| Component | Nickname | Calculation | Purpose |
|---|---|---|---|
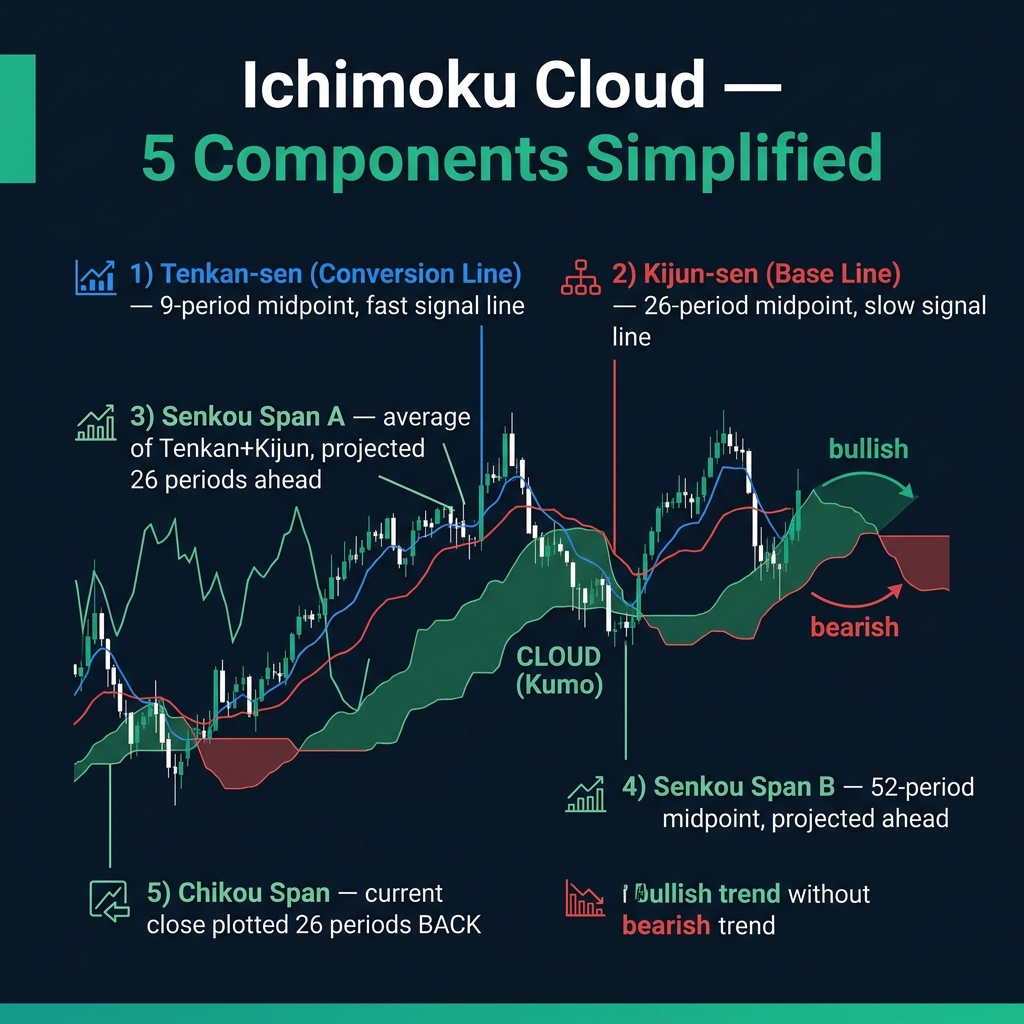
| Tenkan-sen | Conversion Line | 9-period midpoint | Fast signal line (like a fast MA) |
| Kijun-sen | Base Line | 26-period midpoint | Slow signal line (like a slow MA) |
| Senkou Span A | Leading Span A | Average of Tenkan + Kijun, projected 26 ahead | One edge of the Cloud |
| Senkou Span B | Leading Span B | 52-period midpoint, projected 26 ahead | Other edge of the Cloud |
| Chikou Span | Lagging Span | Closing price, plotted 26 periods back | Confirmation — compares now to then |
The Cloud (Kumo) is the shaded area between Senkou Span A and B. It's the most important part:
- Green cloud (Span A above Span B) → bullish environment
- Red cloud (Span B above Span A) → bearish environment
- Thick cloud → strong S&R, hard to break through
- Thin cloud → weak S&R, easy to break through
Simple Trading Signals
The 3 Simple Rules
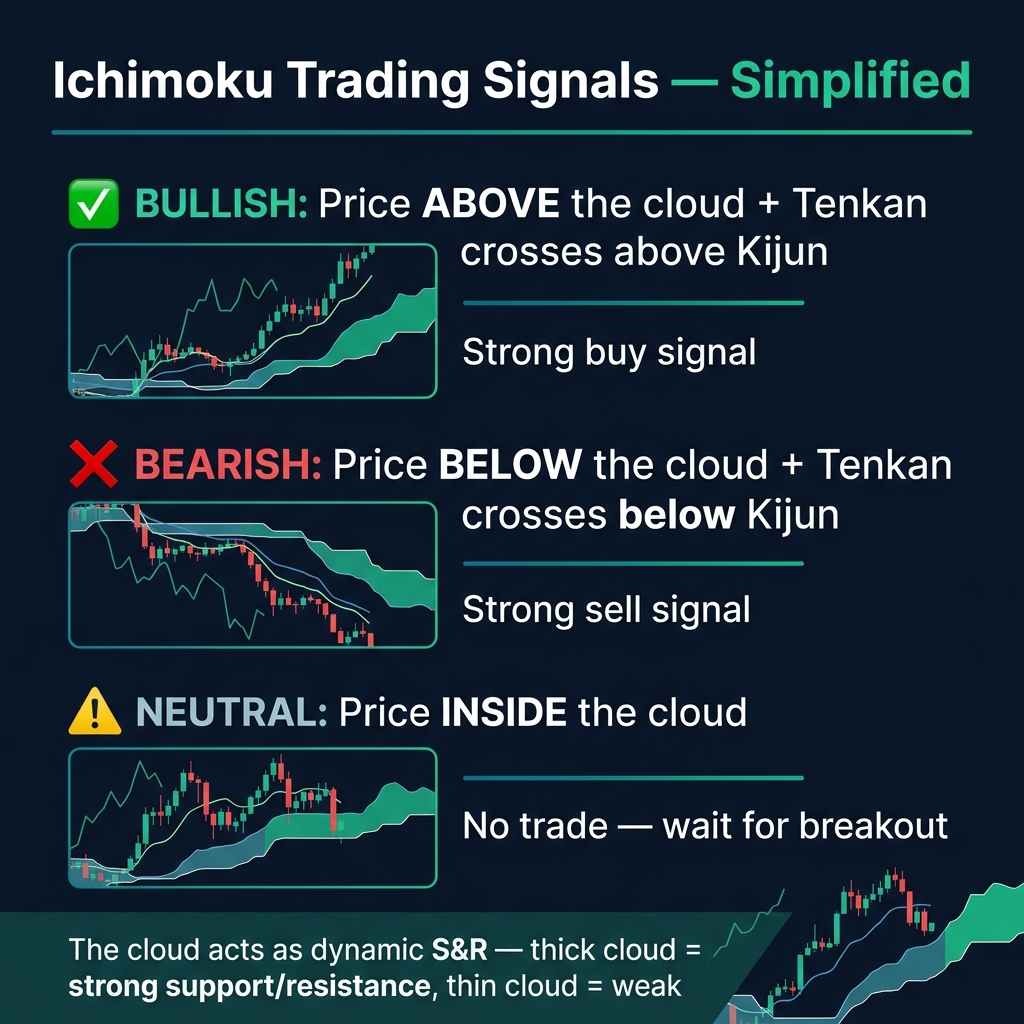
- Price above the cloud → look for BUY setups only
- Price below the cloud → look for SELL setups only
- Price inside the cloud → DON'T TRADE (wait for a breakout)
Crossover Signals
- Tenkan crosses above Kijun (above the cloud) → strong buy signal
- Tenkan crosses below Kijun (below the cloud) → strong sell signal
- Crossovers INSIDE the cloud are weak — avoid them
💡 The beginner's shortcut: If it feels overwhelming, just focus on the Cloud. Price above cloud = bullish. Price below cloud = bearish. That single rule gives you 80% of Ichimoku's value.
Quick Recap
- ✅ Ichimoku shows trend, momentum, and S&R in one indicator
- ✅ The Cloud (Kumo) is the most important part — acts as dynamic S&R
- ✅ Above cloud = bullish. Below cloud = bearish. Inside = don't trade
- ✅ Tenkan/Kijun crossovers = entry signals (strongest outside the cloud)
- ✅ Works best on Daily and H4 timeframes — noisy on lower timeframes
🎯 Your Action Step
Add Ichimoku Cloud to USD/JPY on the Daily chart. Is price currently above, below, or inside the cloud? What color is the cloud ahead (the projected part)? This tells you at a glance whether the market is bullish, bearish, or undecided — that's the power of Ichimoku.