Stop Drawing Random Lines on Your Chart
Every beginner's chart looks the same: dozens of horizontal lines covering every possible level, turning a clean chart into a colorful mess. The result? Analysis paralysis — you have so many levels that none of them mean anything.
Professional traders don't draw more lines. They draw fewer, better lines. This lesson teaches you the exact process to identify the S&R levels that actually matter — and ignore the noise.
The 4-Step Process for Drawing S&R
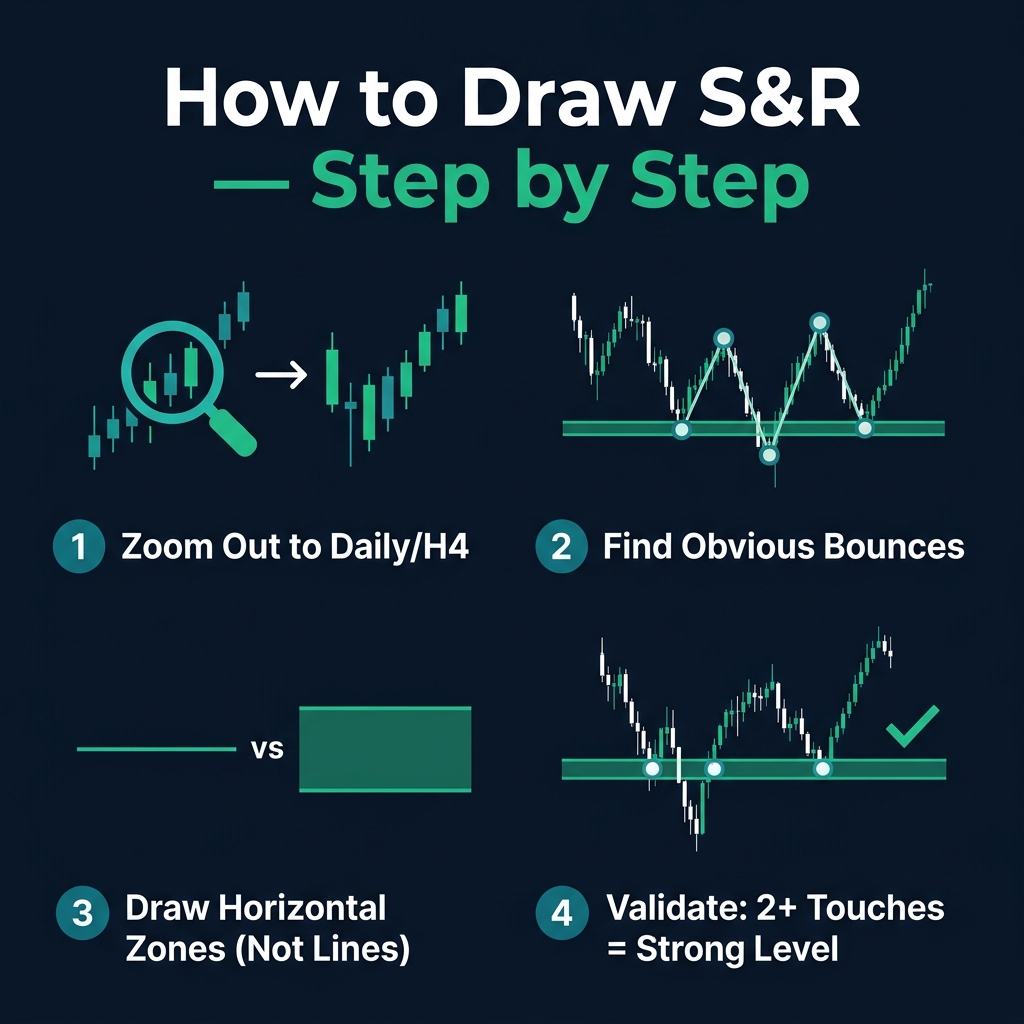
Step 1 — Zoom Out First
Start on the Daily or H4 timeframe, even if you trade on M15 or H1. Higher-timeframe levels are respected by more traders and hold more weight.
Why? Because a level visible on the Daily chart is seen by every trader in the world — from scalpers to swing traders to fund managers. A level only visible on M5? Only day traders see it.
Step 2 — Find the Obvious Bounces
Look for prices where the market has visibly reversed or paused multiple times. The keyword is obvious. If you have to squint to see it, it's not a key level.
Ask yourself: "If a trader glanced at this chart for 5 seconds, would they notice this level?" If yes, it's worth drawing.
Step 3 — Draw Zones, Not Lines
Support and resistance are areas, not exact prices. Price rarely bounces from the exact same pip. Wicks overshoot, spreads vary, and institutional orders fill across a range.
💡 Draw a zone that covers the cluster of highs/lows. Make it 5-20 pips wide depending on the timeframe and instrument.
Step 4 — Validate: 2+ Touches = Real Level
A price that bounced once might be a coincidence. A price that bounced 2-3 times is a level the market respects. The more touches, the stronger the level.
| Touches | Strength | Action |
|---|---|---|
| 1 | Weak | Note it, don't trade it yet |
| 2 | Moderate | Mark it as a potential zone |
| 3+ | Strong | This is a major level — add to your chart |
The "Less Is More" Rule
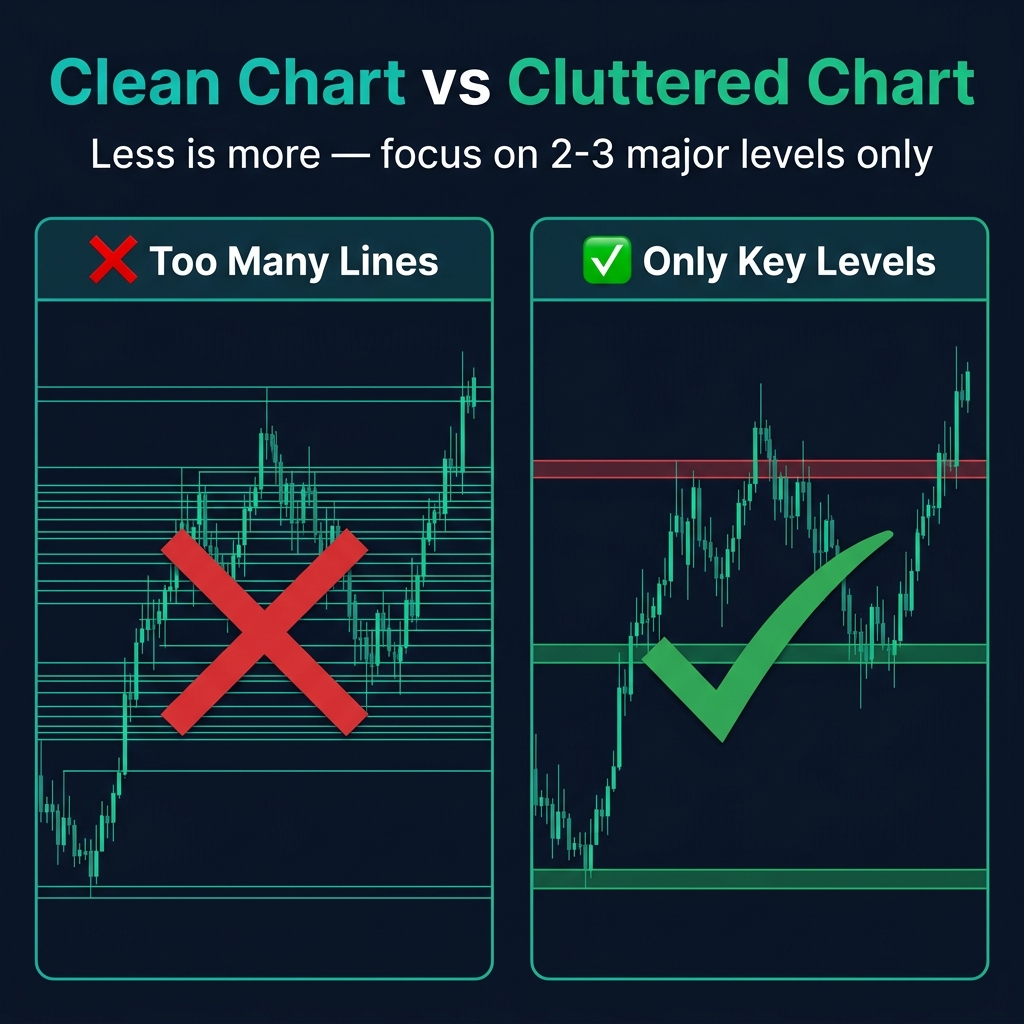
Here's a rule that will instantly improve your chart analysis:
🎯 Maximum 3-4 support levels and 3-4 resistance levels on any single chart. If you have more, you're overthinking it.
Why does clutter hurt? Because when every price has a line near it, you can't tell which levels actually matter. You end up second-guessing every trade.
What to Keep vs Remove
- Keep: Levels with 2+ touches on Daily/H4, levels near round numbers (1.1000, 1.2000), levels where price reacted with strong candles
- Remove: Levels with only 1 touch, levels on M5/M1 timeframes, levels that haven't been tested in months
Body Close vs Wick — Which Matters?
A common confusion: should you draw your level at the candle body or the wick tip?
The answer: focus on candle bodies for the core zone, and let wicks extend beyond it. Here's why:
- Bodies represent where most traders opened and closed their positions — this is the "real" price agreement
- Wicks represent temporary extremes — stop-loss triggers, liquidity grabs, and panic reactions
Place your zone at the cluster of closing prices, and allow for wicks to poke beyond it. This prevents being faked out by a wick that briefly violates the level.
Common Drawing Mistakes
- "Forcing lines to fit" — If you're bending or angling a horizontal line to connect points, it's not a real level. Horizontal S&R should be horizontal.
- "Using the same levels for months" — Markets evolve. Review and update your levels weekly.
- "Drawing levels on very low timeframes" — M1 and M5 levels have too much noise. Stick to H1 and above for reliable levels.
- "Ignoring the left side of the chart" — Scroll left. Historical levels that were important 3-6 months ago often come back to life.
Quick Recap
- ✅ Always start on Daily/H4 timeframe — zoom out before zooming in
- ✅ Draw zones (5-20 pips wide), not thin lines
- ✅ A level needs at least 2 touches to be reliable
- ✅ Keep your chart clean: 3-4 levels max on each side
- ✅ Focus on candle body clusters for zone placement
🎯 Your Action Step
Open GBP/USD on the Daily chart. Follow the 4-step process: zoom out, find the obvious bounces, draw zones (not lines), and validate. You should end up with no more than 3 support zones and 3 resistance zones. Switch to H1 — do these same levels show up? They should.