Stop Overcomplicating It — Here's How to Actually Count Waves
Wave counting has a reputation for being impossibly complex. Ask 5 Elliott Wave analysts to count the same chart, and you'll get 5 different answers. That's because most people try to achieve academic perfection on every wave. Forget that approach.
This lesson teaches you a practical, high-probability method for wave counting that works in real-time trading. You won't count every sub-wave on a Weekly chart going back to 2010. Instead, you'll learn to identify the most tradable wave on any chart in under 2 minutes.
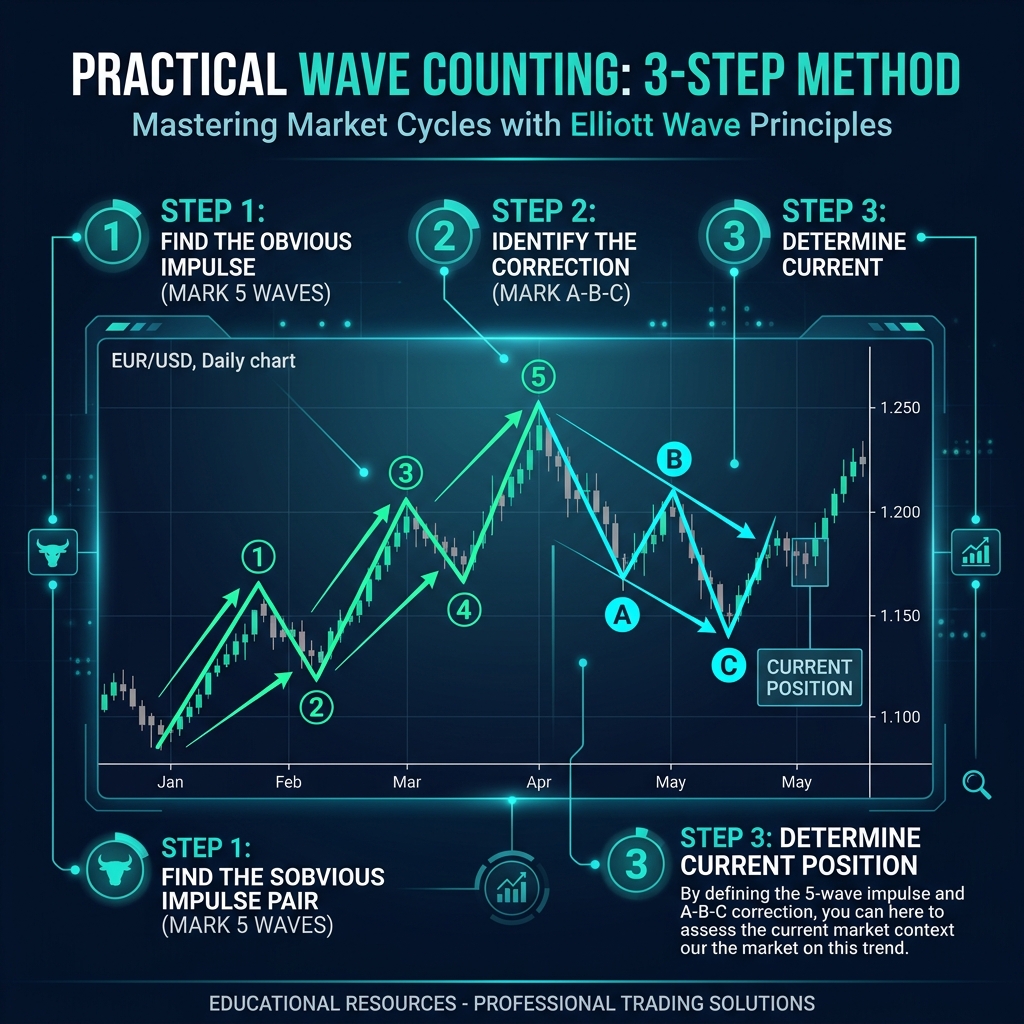
The Practical Wave-Counting Method
Step 1: Zoom Out and Find the Impulse
Start on a timeframe two levels above your trading timeframe. If you trade H4, look at the Daily or Weekly. Your goal is simple: find a clear 5-wave impulse structure.
Don't force it. If you can't see 5 clear waves within 10 seconds, the structure probably isn't a clean impulse — move to a different pair or timeframe.
Step 2: Identify Where You Are Now
This is the only question that matters for trading: "Which wave are we currently in?"
| If You're In... | What to Expect | Trading Action |
|---|---|---|
| Wave 1 or early Wave 3 | The trend is just starting — big moves ahead | Look for pullback entries (Wave 2 buy zone) |
| Wave 3 (middle) | The strongest part — momentum is your friend | Enter on small pullbacks, use trailing stops |
| Wave 4 | Choppy correction — one more push coming | Wait for Wave 4 to end, prepare for Wave 5 entry |
| Wave 5 | Last leg — watch for exhaustion signals | Trade carefully, take partial profits, watch for divergence |
| A-B-C correction | Counter-trend chop — the messiest phase | Stay out or trade the correction boundaries only |
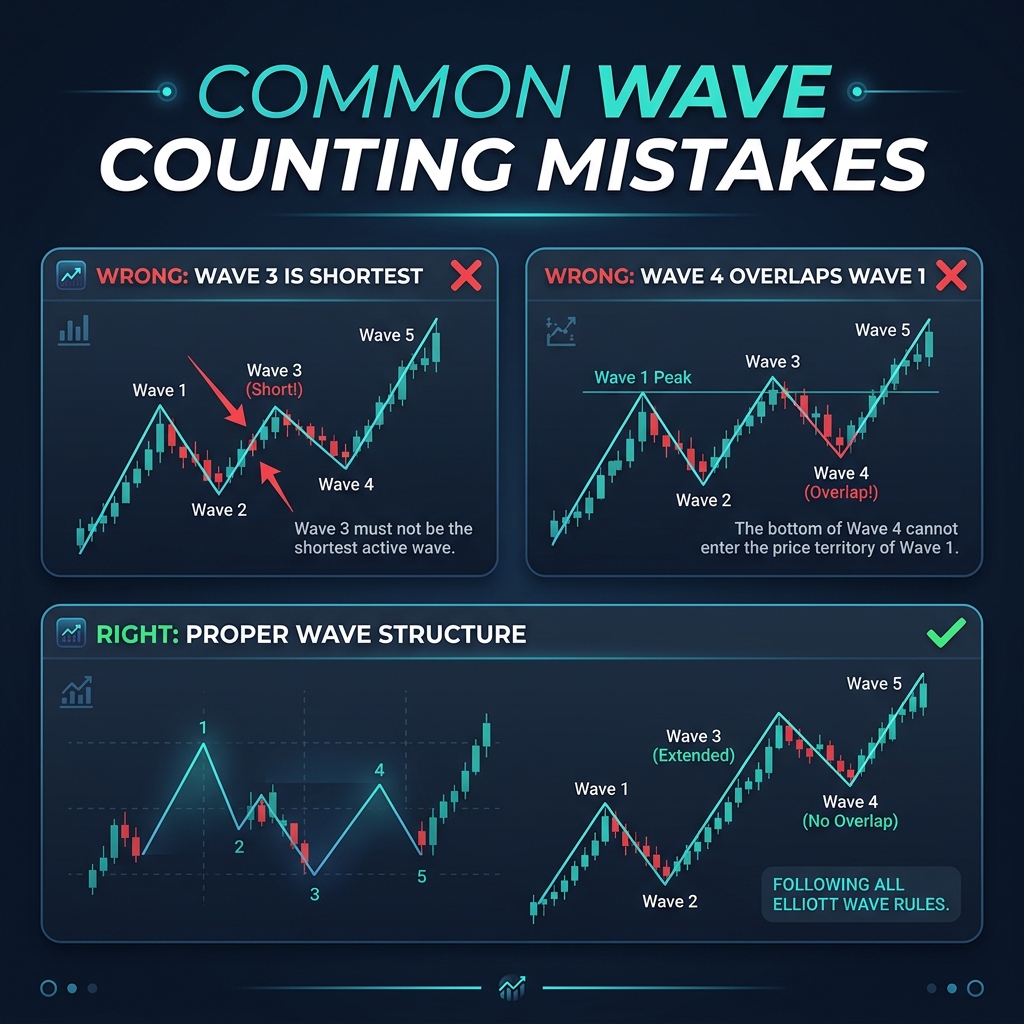
Step 3: Apply the 3 Rules to Validate
Once you've labeled the waves, check the 3 unbreakable rules:
- Does Wave 2 stay above Wave 1's start? ✅ or ❌
- Is Wave 3 longer than at least one of Wave 1 or Wave 5? ✅ or ❌
- Does Wave 4 stay above Wave 1's peak? ✅ or ❌
If any answer is ❌, your count is wrong. Restart.
Using Fibonacci for Wave Counting
Fibonacci levels are your best friend for wave counting. They give you expected targets for each wave:
| Wave | Fibonacci Relationship | Typical Level |
|---|---|---|
| Wave 2 | Retracement of Wave 1 | 50% - 61.8% |
| Wave 3 | Extension of Wave 1 | 161.8% - 261.8% |
| Wave 4 | Retracement of Wave 3 | 38.2% - 50% |
| Wave 5 | Equal to Wave 1, or 61.8% of Wave 1 | 100% or 61.8% |
| Wave C | Equal to Wave A, or 161.8% of Wave A | 100% or 161.8% |
How this helps in practice: If Wave 1 was 200 pips, you'd expect Wave 3 to reach approximately 324 pips (200 × 1.618). If price stalls around that level, there's a good chance Wave 3 is complete and Wave 4 correction is about to begin.
The 80/20 of Wave Trading
You don't need to catch all 5 waves. Focus on the two highest-probability trades:
Trade 1: Buy the Wave 2 Pullback
Wave 2 typically retraces 50-61.8% of Wave 1. If you can identify Wave 1 completing (first impulse move), wait for the pullback to the 50-61.8% Fibonacci zone and enter long. Your stop goes below Wave 1's start. Your target is Wave 3 — which is usually the biggest wave.
Trade 2: Buy the Wave 4 Pullback
Wave 4 retraces 38.2-50% of Wave 3. It's shallower than Wave 2 and offers a tighter entry for the final Wave 5 push. The risk is lower (Wave 5 is shorter than Wave 3), but the entry is cleaner.
The wave to avoid: Trying to catch Wave 5's end and trade the A-B-C correction. Wave 5 endings are hard to pinpoint, and corrections are choppy nightmares. Leave that to the experts.
Common Counting Mistakes
- Forcing a count: If you're twisting and bending reality to make waves fit, the structure isn't there. Move on.
- Counting on too low a timeframe: Wave counts on M1 are pure noise. Start on Daily or H4 minimum.
- Ignoring the 3 rules: "Wave 3 looks short but maybe it extends later" — no. If the rules are broken, the count is wrong. Period.
- Over-labeling: You don't need to find waves within waves within waves. One clear impulse structure is enough for a trade.
Quick Recap
- Focus on which wave you're in, not perfect labeling of every sub-wave
- The best trades: buy Wave 2 pullbacks (50-61.8%) and Wave 4 pullbacks (38.2-50%)
- Use Fibonacci levels to predict wave targets and validate your count
- Don't force a count — if it doesn't look clear in 10 seconds, move on
- Avoid trading Wave 5 endings and A-B-C corrections unless you're highly experienced
🎯 Your Action Step
Open EUR/USD on the Daily chart. Find the most recent clear Wave 1 move (a strong impulse after a correction). Now measure Wave 1's size in pips. Use Fibonacci to project where Wave 3 should reach (1.618x Wave 1). Did price actually reach that level? Did it overshoot or fall short? This exercise calibrates your expectations for wave targets.