The Divergence Nobody Talks About
In the last lesson, you learned that regular divergence warns you about potential reversals. Now here's the twist: there's another type of divergence that tells you the trend is about to continue — and most traders have never heard of it.
Hidden divergence is the continuation trader's secret weapon. While everyone else is looking for reversals, you'll be using this signal to ride the trend further, entering at pullbacks with confidence.
What Is Hidden Divergence?
Hidden divergence occurs when price and an oscillator disagree — but in the opposite way from regular divergence. Instead of warning about a reversal, it confirms that the existing trend still has fuel in the tank.
Think of it this way: the market pulls back temporarily, and some traders think the trend is over. But the indicator says "nope — the underlying momentum is still strong." That's hidden divergence telling you the pullback is just a rest stop, not the final destination.
Two Types of Hidden Divergence
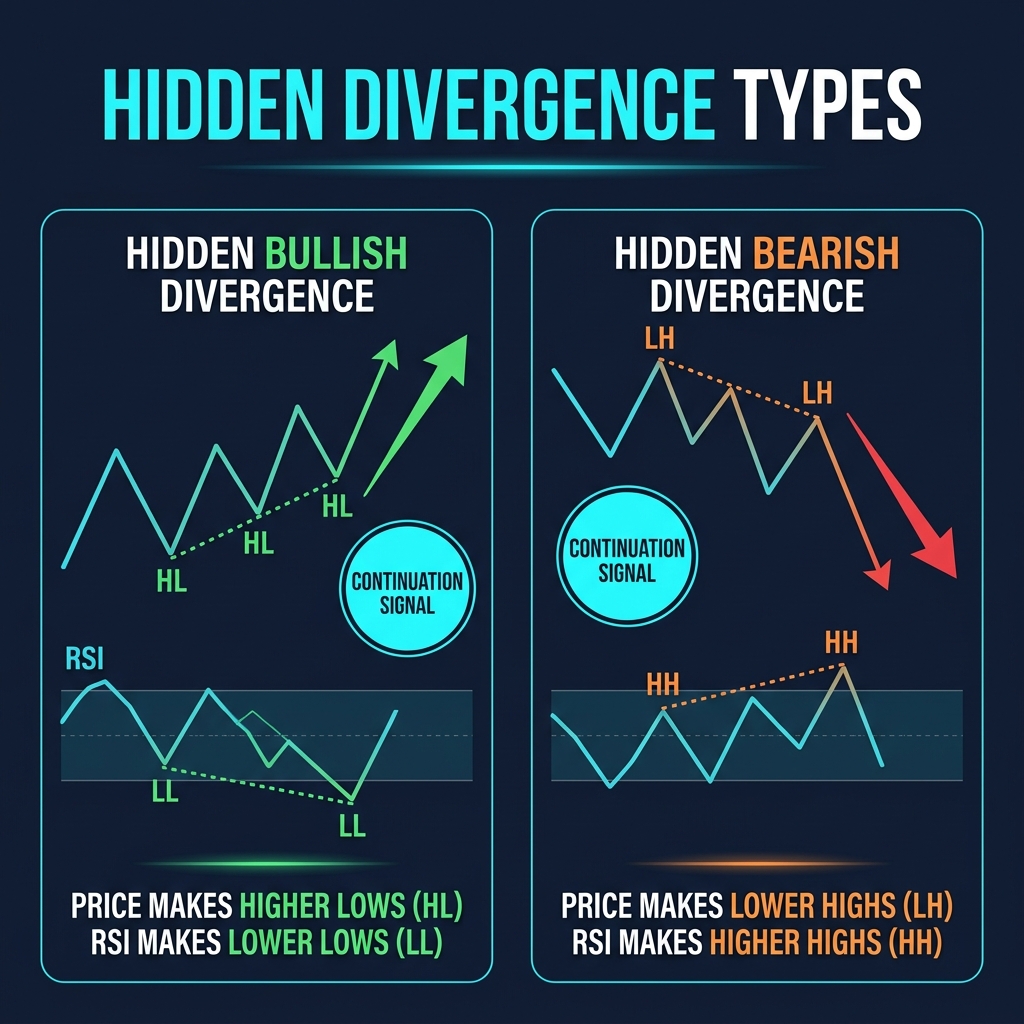
Hidden Bullish Divergence (Uptrend Continues)
Price makes a higher low, but RSI makes a lower low.
Translation: price is respecting the uptrend structure (higher lows), but the indicator dipped lower — suggesting the pullback was just temporary. Buyers are still in control. The uptrend is likely to resume.
Real example: USD/JPY is in an uptrend. Price pulls back from 155.80 to 154.90 (higher low compared to previous 154.20). But RSI drops from 42 to 38 (lower low compared to previous 40). Hidden bullish divergence. Price bounces and pushes to 156.50 — a 160-pip continuation.
Hidden Bearish Divergence (Downtrend Continues)
Price makes a lower high, but RSI makes a higher high.
Translation: price is respecting the downtrend structure (lower highs), but the indicator popped higher — it's a fake recovery. Sellers are still in control. The downtrend will likely continue.
Real example: AUD/USD is trending down. Price rallies from 0.6420 to 0.6480 (lower high compared to previous 0.6510). RSI climbs from 52 to 58 (higher high compared to previous 55). Hidden bearish divergence. Price drops to 0.6350 the next day.
| Type | Price Action | RSI Behavior | Signal | Trading Direction |
|---|---|---|---|---|
| Hidden Bullish | Higher Low | Lower Low | Uptrend Continues ↑ | Buy the pullback |
| Hidden Bearish | Lower High | Higher High | Downtrend Continues ↓ | Sell the rally |
Regular vs Hidden Divergence — The Key Difference
This is where 90% of traders get confused. Here's the clearest way to remember it:
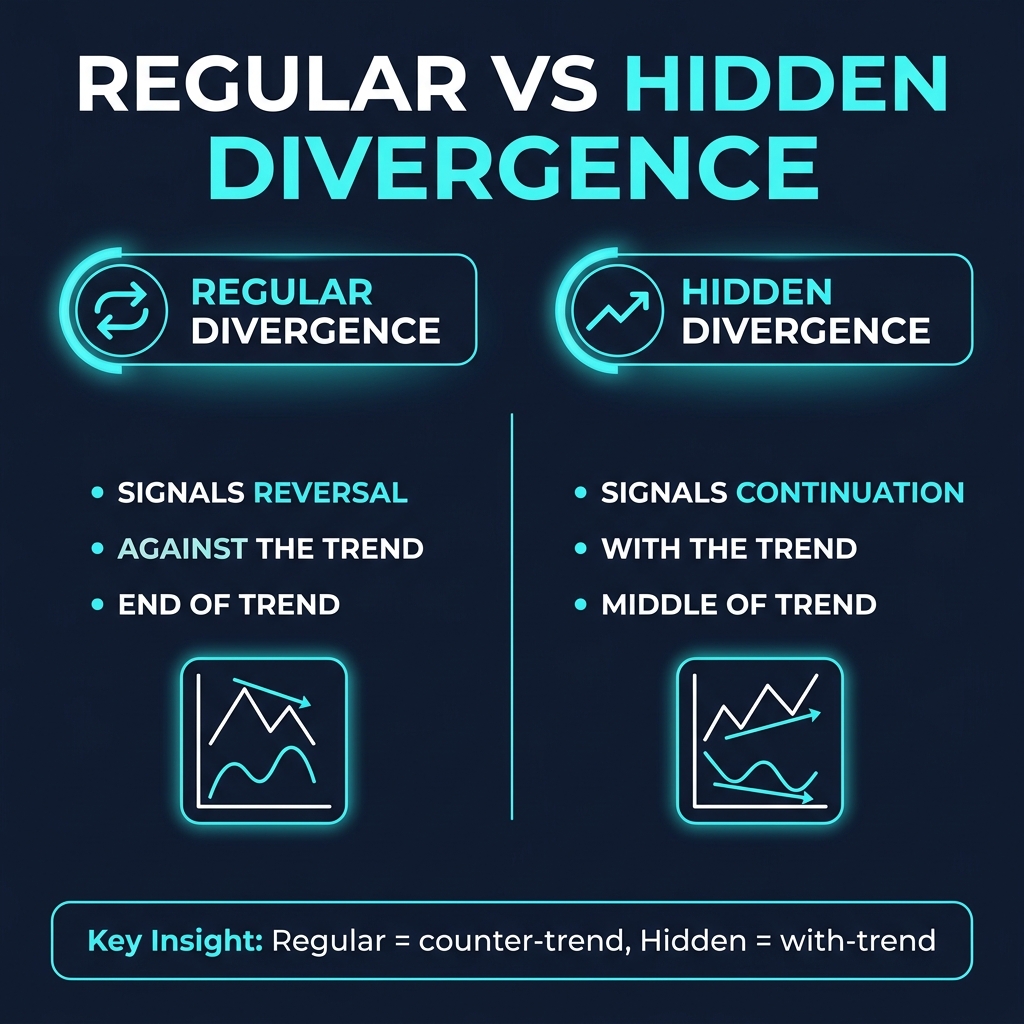
- Regular divergence = the trend is dying → potential REVERSAL
- Hidden divergence = the pullback is dying → trend CONTINUES
Regular divergence fights the trend. Hidden divergence rides with it. And in most market conditions, trading with the trend has a higher probability of success — which is why hidden divergence can actually be more reliable than regular divergence.
How to Trade Hidden Divergence
Step 1: Confirm the Trend
Hidden divergence only works when there's a clear trend in place. Use the 50 EMA or price structure (higher highs/higher lows for uptrend, lower highs/lower lows for downtrend).
Step 2: Wait for a Pullback
You need price to pull back toward a support/resistance zone or moving average. Hidden divergence forms during pullbacks, not at the trend's extreme.
Step 3: Spot the Hidden Divergence
Compare the pullback lows/highs on price versus the RSI. If they disagree (price makes a higher low but RSI makes a lower low), you have hidden bullish divergence.
Step 4: Enter on Confirmation
- Entry: When a reversal candle forms at the pullback level (pin bar, engulfing)
- Stop loss: Below the pullback low (bullish) or above the pullback high (bearish)
- Target: The previous swing high/low, or 1:2 risk-reward minimum
Real trade setup — Hidden bullish on GBP/USD H4:
- Uptrend confirmed — price above 50 EMA, making higher highs
- Pullback to 1.2680 (higher low vs previous 1.2640)
- RSI drops to 36 (lower low vs previous 39) → hidden bullish divergence
- Bullish pin bar forms at 200 EMA confluence
- Entry: 1.2695 | Stop: 1.2655 (40 pips) | Target: 1.2785 (90 pips)
- RR: 1:2.25 ✅
When Hidden Divergence Fails
Hidden divergence is not bulletproof. Watch out for:
- Trend exhaustion: If the trend has been running for weeks without a significant correction, the "continuation" might actually be the last gasp. Check the higher timeframe.
- Major news events: An NFP or FOMC rate decision can invalidate any technical signal. Don't trade hidden divergence right before high-impact news.
- Shallow pullbacks: If the pullback barely retraces 20% of the last swing, the hidden divergence signal is weak. Stronger pullbacks (38.2%–61.8% Fibonacci) give better setups.
Quick Recap
- Hidden divergence signals trend continuation, not reversal
- Hidden bullish: price higher low + RSI lower low = uptrend continues
- Hidden bearish: price lower high + RSI higher high = downtrend continues
- Regular divergence fights the trend; hidden divergence rides with it
- Best used during pullbacks within established trends
- Always confirm with price action and structure — divergence alone is not enough
🎯 Your Action Step
Open USD/JPY or GBP/USD on the H4 timeframe. Add RSI (14). Find a clear uptrend or downtrend from the past month. Now look at the pullbacks within that trend — can you spot any hidden divergence where price made a higher low but RSI made a lower low (or vice versa)? Mark at least one example and note whether the trend continued afterward.