The Most Reliable Pattern in Trading
If there's one chart pattern that professional traders take seriously above all others, it's the Head and Shoulders. It's one of the most reliable reversal patterns in technical analysis — and when traded correctly, it offers clear entry, stop loss, and profit target levels with a typically favorable risk-to-reward ratio.
The problem? Most traders spot it but trade it wrong. Let's fix that.
Anatomy of the Pattern
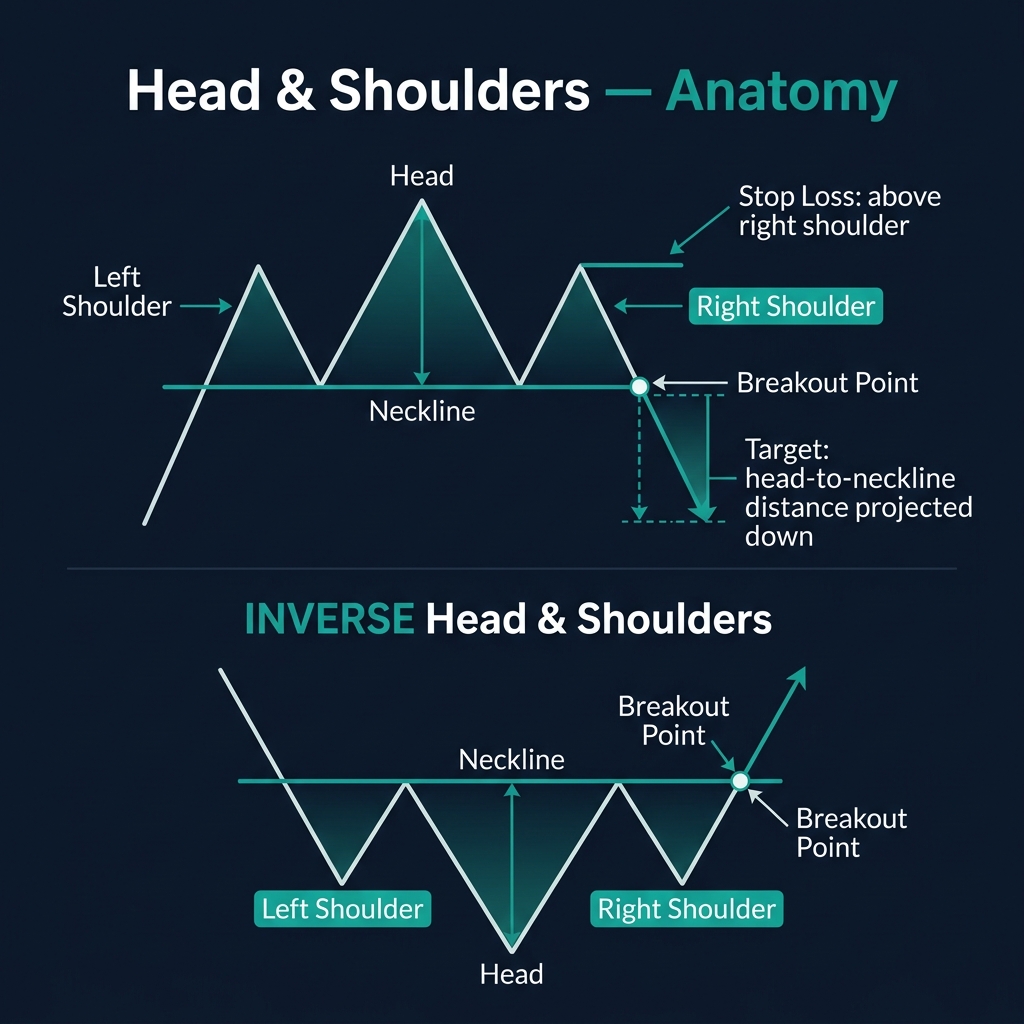
Standard Head & Shoulders (Bearish Reversal)
This pattern forms at the top of an uptrend and signals a potential reversal to the downside:
- Left Shoulder: Price rises to a peak, then pulls back to a support level
- Head: Price rallies again to a higher peak (the highest point of the pattern), then pulls back to roughly the same support level
- Right Shoulder: Price rises a third time but fails to reach the head — forming a lower peak similar in height to the left shoulder
- Neckline: The line connecting the two trough lows between the shoulders. This is the trigger line
- Breakout: Price breaks below the neckline → Reversal confirmed
Inverse Head & Shoulders (Bullish Reversal)
The exact mirror image — forms at the bottom of a downtrend:
- Three valleys instead of three peaks
- The head is the lowest valley
- Neckline connects the two highs between the valleys
- Breakout above the neckline confirms a bullish reversal
💡 Key insight: The right shoulder being lower than the head is the market telling you: "Buyers tried to push higher but failed. Momentum is shifting." This is the early warning before the neckline breaks.
The Neckline: Your Most Important Line
The neckline isn't always perfectly horizontal — it can slope up or down:
| Neckline Slope | Implication |
|---|---|
| Flat (horizontal) | Standard pattern — most textbook |
| Sloping upward | Pattern is slightly weaker — bearish momentum is weaker |
| Sloping downward | Pattern is stronger — bearish pressure is already building |
The pattern is NOT confirmed until the neckline breaks. Before that, it's just three peaks — nothing more.
How to Trade It — Step by Step
Step 1: Confirm a Prior Trend
H&S is a reversal pattern — there must be an existing trend to reverse. Standard H&S needs a prior uptrend. Inverse H&S needs a prior downtrend.
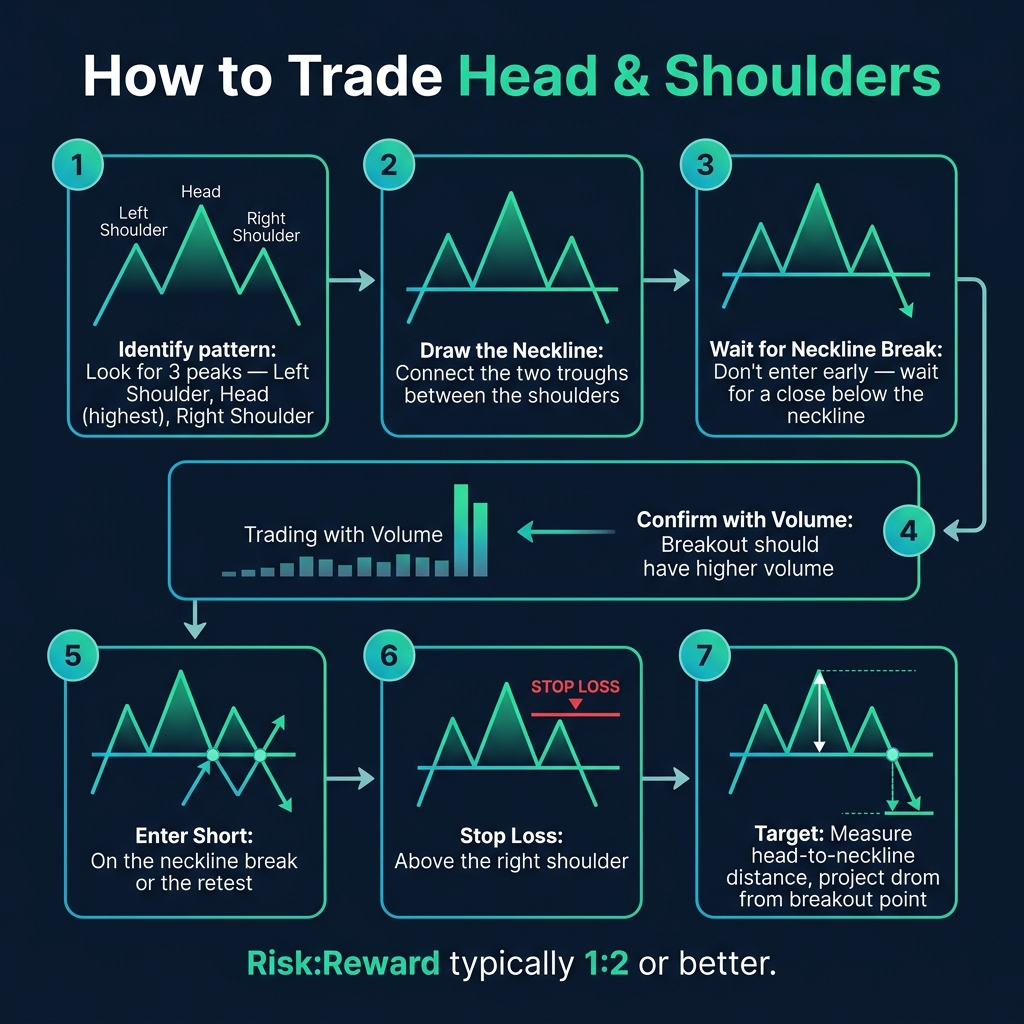
Step 2: Identify the Pattern
Look for three distinct peaks where the middle one (head) is the highest. The two shoulders should be at roughly similar heights.
Step 3: Draw the Neckline
Connect the two trough lows. This line is your trigger.
Step 4: Wait for Neckline Break
Do NOT enter early. Wait for a candlestick close below the neckline. Intraday wicks below don't count.
Step 5: Enter the Trade
- Aggressive: Enter on the neckline break candle
- Conservative: Wait for the neckline retest — price often comes back to test the broken neckline from below before continuing down
Step 6: Set Stop Loss
Place your stop loss above the right shoulder. This is the logical invalidation point — if price goes back above the right shoulder, the pattern has failed.
Step 7: Calculate Your Target
Measure the distance from the top of the head to the neckline. Project that distance downward from the neckline breakout point. That's your minimum target.
🎯 Typical risk-to-reward: 1:2 or better. If the right shoulder gives you 50 pips of risk and the measured move gives you 100+ pips of target, that's a great trade setup.
Confirmation Tools
- Volume: Ideally, volume should decrease through the pattern and spike on the neckline breakout
- RSI: Look for bearish divergence between the head and the right shoulder — RSI making lower highs while price makes a similar high
- MACD: A MACD crossover confirming the neckline break adds confidence
Common Mistakes
| Mistake | Fix |
|---|---|
| Entering before the neckline breaks | Wait for a close below — don't anticipate |
| Shoulders at very different heights | Pattern should be roughly symmetrical — extreme asymmetry reduces reliability |
| Ignoring the prior trend | No prior trend = no reversal pattern |
| Using only on small timeframes | H&S on M5 is noise — H4 and Daily patterns are much more reliable |
Quick Recap
- ✅ H&S = 3 peaks (middle highest) = bearish reversal after an uptrend
- ✅ Inverse H&S = 3 valleys (middle lowest) = bullish reversal after a downtrend
- ✅ Neckline break confirms the pattern — not before
- ✅ Target = head-to-neckline distance projected from breakout
- ✅ Stop Loss goes above (or below) the right shoulder
- ✅ Combine with volume and RSI divergence for higher confidence
🎯 Your Action Step
Open GBP/USD on the Daily chart. Scan the past 12 months for any Head & Shoulders or Inverse Head & Shoulders formation. When you find one, draw the neckline, measure the target, and check if the measured move was achieved. This pattern recognition practice is essential for spotting them in real-time.