Riding the Trend — Not Fighting It
While reversal patterns like Double Tops and Head & Shoulders try to catch turning points, continuation patterns let you ride the wave that's already moving. Flags, Pennants, and Wedges are the trader's rest stop — brief pauses in a strong trend before the move continues.
These patterns are some of the most reliable in technical analysis because they tell you the trend is taking a breath, not changing direction. Learn to spot them, and you'll enter strong trends at optimal prices.
The Three Continuation Patterns
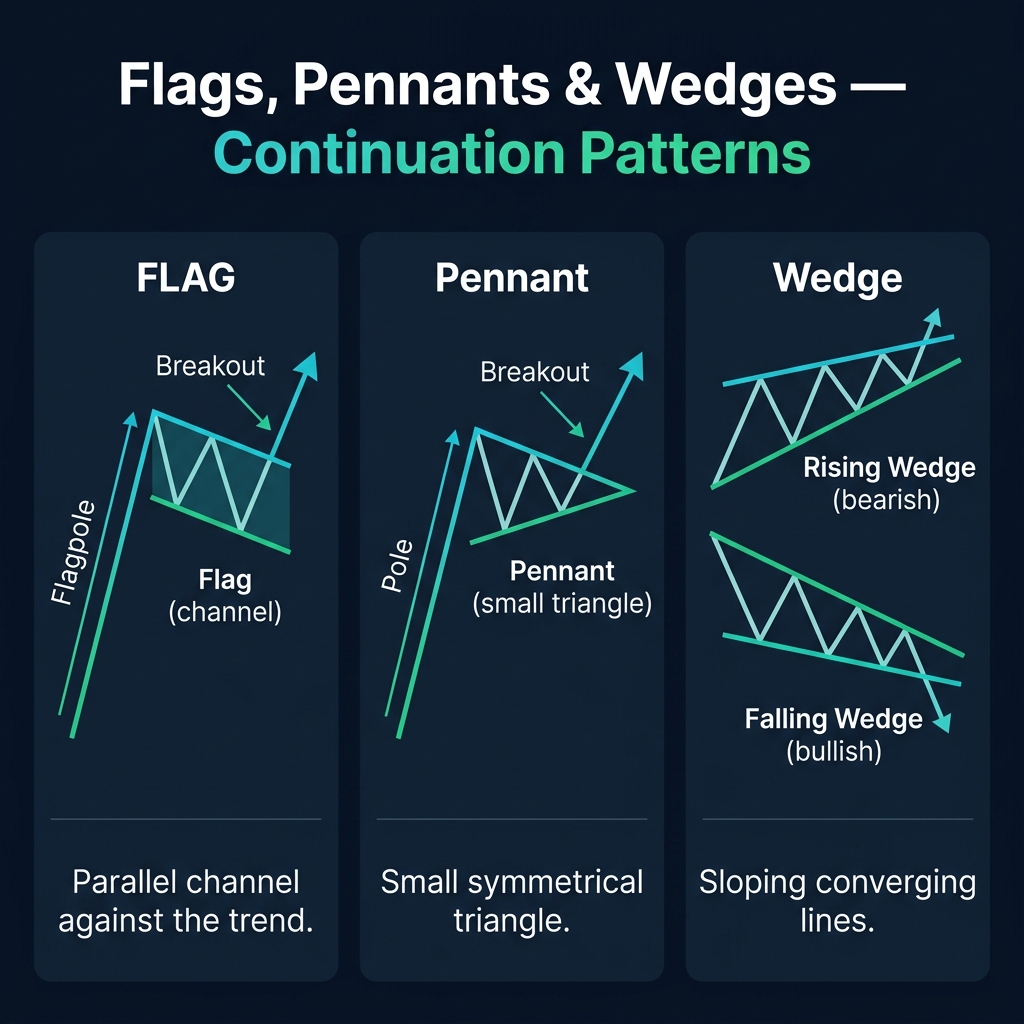
1. Flag Pattern
A flag looks like a small channel that slopes against the trend. It's preceded by a sharp, steep price movement called the "flagpole."
- Bullish flag: Sharp rally (pole) → small downward-sloping channel (flag) → breakout upward
- Bearish flag: Sharp drop (pole) → small upward-sloping channel (flag) → breakout downward
- Key feature: The channel lines are parallel
2. Pennant Pattern
A pennant is similar to a flag but instead of a channel, the consolidation forms a small symmetrical triangle. The converging trendlines create a tightening range.
- Looks like: A flagpole followed by a tiny symmetrical triangle
- Key difference from flag: The lines converge instead of being parallel
- Volume: Volume decreases during the pennant and surges on breakout
3. Wedge Pattern
Wedges have converging trendlines that both slope in the same direction. Unlike triangles (one flat line), both lines of a wedge are sloped.
- Rising wedge: Both lines slope upward → bearish signal (price moving up but losing momentum)
- Falling wedge: Both lines slope downward → bullish signal (price moving down but losing speed)
💡 Important: Rising wedge = bearish. Falling wedge = bullish. This seems counterintuitive but makes sense: a rising wedge means each rally is getting weaker. A falling wedge means each selloff is getting weaker.
How to Trade Them
Entry
- Wait for breakout: Price must close beyond the pattern boundary (above for bullish, below for bearish)
- Conservative approach: Wait for a second candle to confirm the breakout direction before entering
- Volume confirmation: Breakout should come with increasing volume
Stop Loss
- Place your stop at the lowest point of the pattern (for bullish setups)
- Or at the highest point of the pattern (for bearish setups)
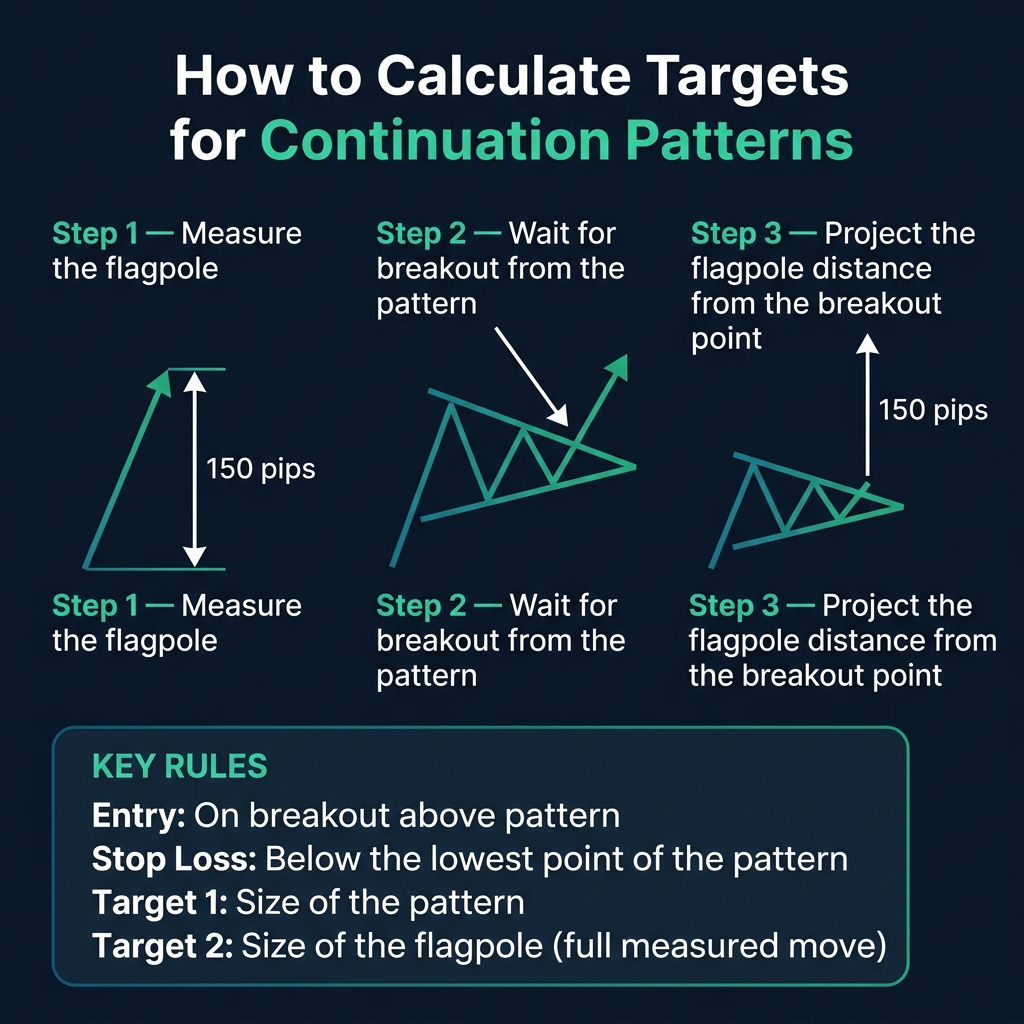
Profit Targets (Two Levels)
- Target 1 (conservative): The height of the pattern itself — projected from the breakout point
- Target 2 (full measured move): The height of the flagpole — projected from the breakout point
The flagpole target is based on the idea that the second leg of the move should roughly equal the first leg. This works surprisingly well in practice.
Comparison Table
| Feature | Flag | Pennant | Wedge |
|---|---|---|---|
| Shape | Parallel channel | Small symmetrical triangle | Converging sloped lines |
| Slope | Against the trend | Against the trend | Can be with or against |
| Duration | Days to weeks | Days to weeks | Weeks to months |
| Volume | Decreasing | Decreasing | Decreasing |
| Breakout | In prior trend's direction | In prior trend's direction | Opposite to wedge slope |
| Reliability | High | High | Moderate to High |
The Most Common Mistakes
| Mistake | Fix |
|---|---|
| No flagpole before the pattern | Without a sharp preceding move, it's not a flag/pennant — it's just consolidation |
| Pattern too long | Flags and pennants should be short (days to 2 weeks). Longer formations lose reliability |
| Confusing wedge direction | Rising wedge = bearish. Falling wedge = bullish. Remember: the wedge shows the trend losing steam |
| Entering before breakout | Always wait for a close outside the pattern boundary |
Quick Recap
- ✅ Flags = parallel channel against the trend → breakout continues the trend
- ✅ Pennants = small symmetrical triangle after a pole → breakout continues the trend
- ✅ Rising Wedge = bearish. Falling Wedge = bullish
- ✅ All require a sharp preceding move (the flagpole)
- ✅ Target = flagpole height projected from the breakout point
- ✅ Volume should decrease in the pattern and increase on breakout
🎯 Your Action Step
Open USD/JPY on the H4 chart and find one flag, one pennant, or one wedge from the past 3 months. Measure the flagpole, calculate the target from the breakout point, and check if the measured move was achieved. This builds your confidence in using these patterns in live trading.