The Math Behind Every Market Move
In 1202, an Italian mathematician named Leonardo Fibonacci discovered a sequence of numbers that appears everywhere in nature — from the spiral of a seashell to the branching of trees. Centuries later, traders realized this same sequence predicts something remarkable: where prices are most likely to bounce during a pullback.
Fibonacci retracement is one of the most popular tools in technical analysis. It doesn't predict the future — but it identifies high-probability zones where price tends to pause, reverse, or accelerate. Master this tool, and you'll know exactly where to look for your next trade.
The Key Fibonacci Levels
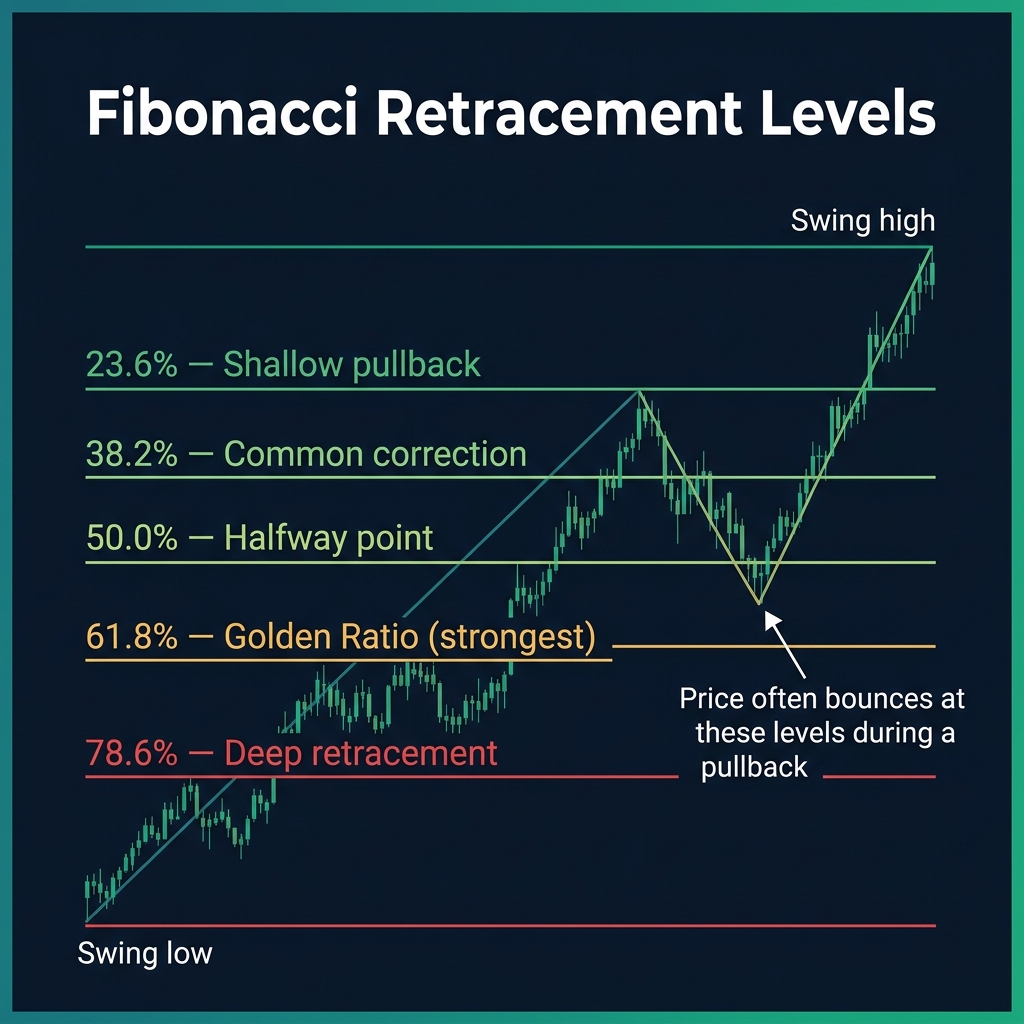
When a market is trending and then pulls back, Fibonacci retracement levels show you where the pullback is most likely to stop. Here are the key levels:
| Level | Name | What It Means |
|---|---|---|
| 23.6% | Shallow pullback | Very strong trend — barely any retracement |
| 38.2% | Common correction | Healthy pullback in a strong trend |
| 50.0% | Halfway point | Not a true Fibonacci ratio, but widely watched |
| 61.8% | Golden Ratio ⭐ | The most powerful level — high-probability reversal zone |
| 78.6% | Deep retracement | Last chance — beyond this, the trend may be invalidated |
🧠 The 61.8% level is called the "Golden Ratio" because it appears naturally in everything from flower petals to galaxy spirals. In trading, it's the level where the most reversals occur.
How to Draw Fibonacci Retracement
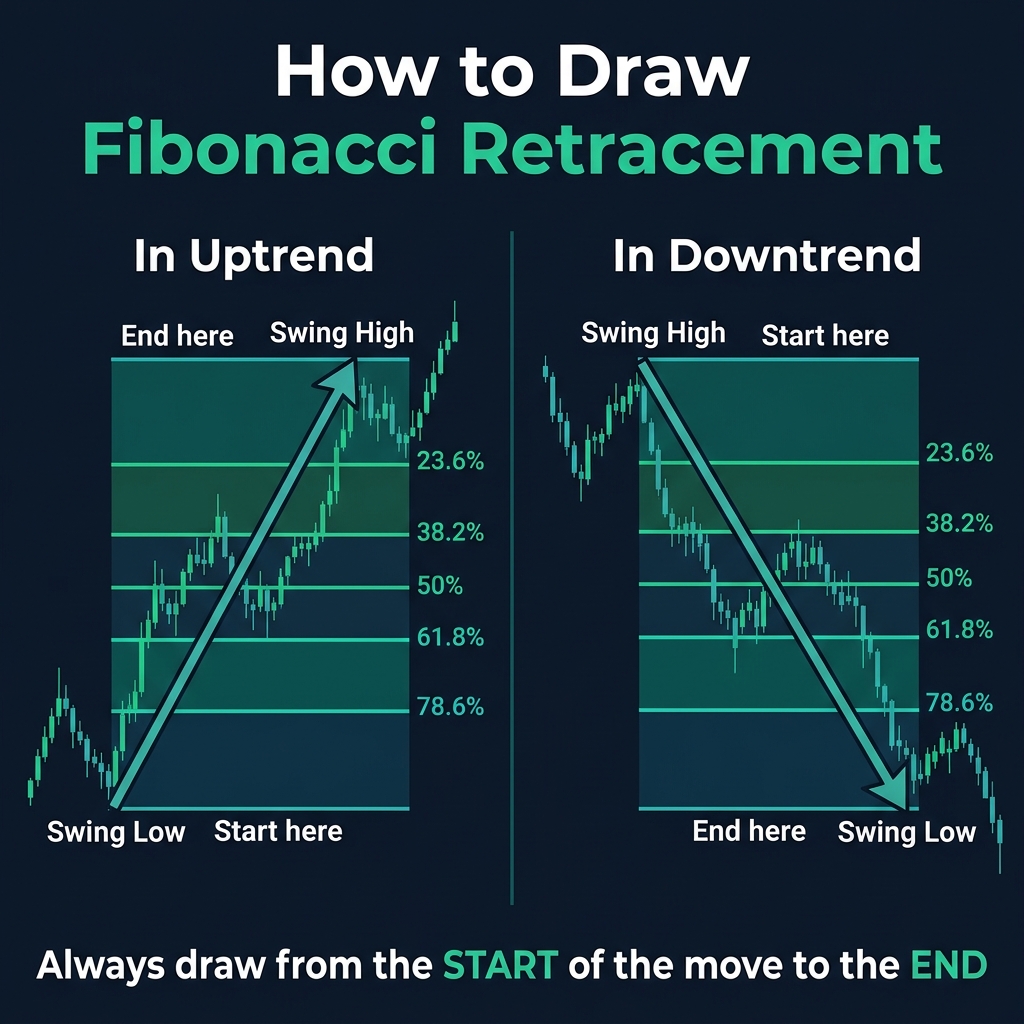
Drawing Fibonacci is simple — but getting it right matters:
In an Uptrend (looking for buy entries)
- Find the Swing Low (bottom of the move)
- Find the Swing High (top of the move)
- Drag the Fibonacci tool from low to high
- The retracement levels appear below the swing high — these are your potential buy zones
In a Downtrend (looking for sell entries)
- Find the Swing High (top of the move)
- Find the Swing Low (bottom of the move)
- Drag the Fibonacci tool from high to low
- The retracement levels appear above the swing low — these are your potential sell zones
Practical Example
If EUR/USD rises from 1.1000 to 1.2000, the Fibonacci levels would be:
| Level | Price |
|---|---|
| 23.6% | 1.1764 |
| 38.2% | 1.1618 |
| 50.0% | 1.1500 |
| 61.8% | 1.1382 |
| 78.6% | 1.1214 |
If price pulls back to 1.1382 (61.8%) and forms a bullish candle, you'd have a high-probability buy setup.
How to Trade Fibonacci Retracement
- Identify the trend — Fibonacci works BEST in trending markets
- Draw the retracement from swing low to swing high (or vice versa)
- Wait for price to pull back to a key level (38.2%, 50%, or 61.8%)
- Look for confirmation — a candlestick signal (hammer, engulfing) at the Fibonacci level
- Enter the trade in the direction of the original trend
- Stop loss — below the next Fibonacci level (e.g., if entering at 50%, SL below 61.8%)
⚠️ Never trade Fibonacci alone. Always combine with candlestick patterns, S&R levels, or other indicators for confirmation.
Common Mistakes
- "I'll enter at the first Fibonacci level I see" — Wait for price to ACTUALLY reach the level and show a reaction
- "I drew it wrong — the levels don't match" — Make sure you identify the correct swing low and swing high
- "Fibonacci works in every market condition" — It's most effective in trending markets. In choppy/ranging conditions, it's unreliable
- "The 61.8% level always holds" — No level is guaranteed. Use confirmation (candlestick patterns, volume) before entering
Quick Recap
- ✅ Fibonacci retracement identifies where pullbacks are likely to end
- ✅ Key levels: 23.6%, 38.2%, 50%, 61.8%, 78.6%
- ✅ The 61.8% Golden Ratio is the most powerful reversal zone
- ✅ Always draw from swing low → swing high (uptrend) or vice versa
- ✅ Combine with candlestick signals and S&R for confirmation
🎯 Your Action Step
Open EUR/USD on the Daily chart. Find the most recent strong trend move (at least 200 pips). Apply the Fibonacci retracement tool. Did price pull back to the 38.2% or 61.8% level? Did it bounce? This is how you start building your Fibonacci trading instinct.