You Know Where to Enter — But Where Do You Exit?
In the last lesson, you learned how Fibonacci retracement helps you find where to enter a trade during a pullback. But here's the million-dollar question: once you're in, where do you take profit?
This is where Fibonacci extensions come in. While retracement measures how far price pulls back, extensions project how far price could travel beyond the original move. They give you objective, math-based profit targets — no guessing required.
Fibonacci Extension Levels
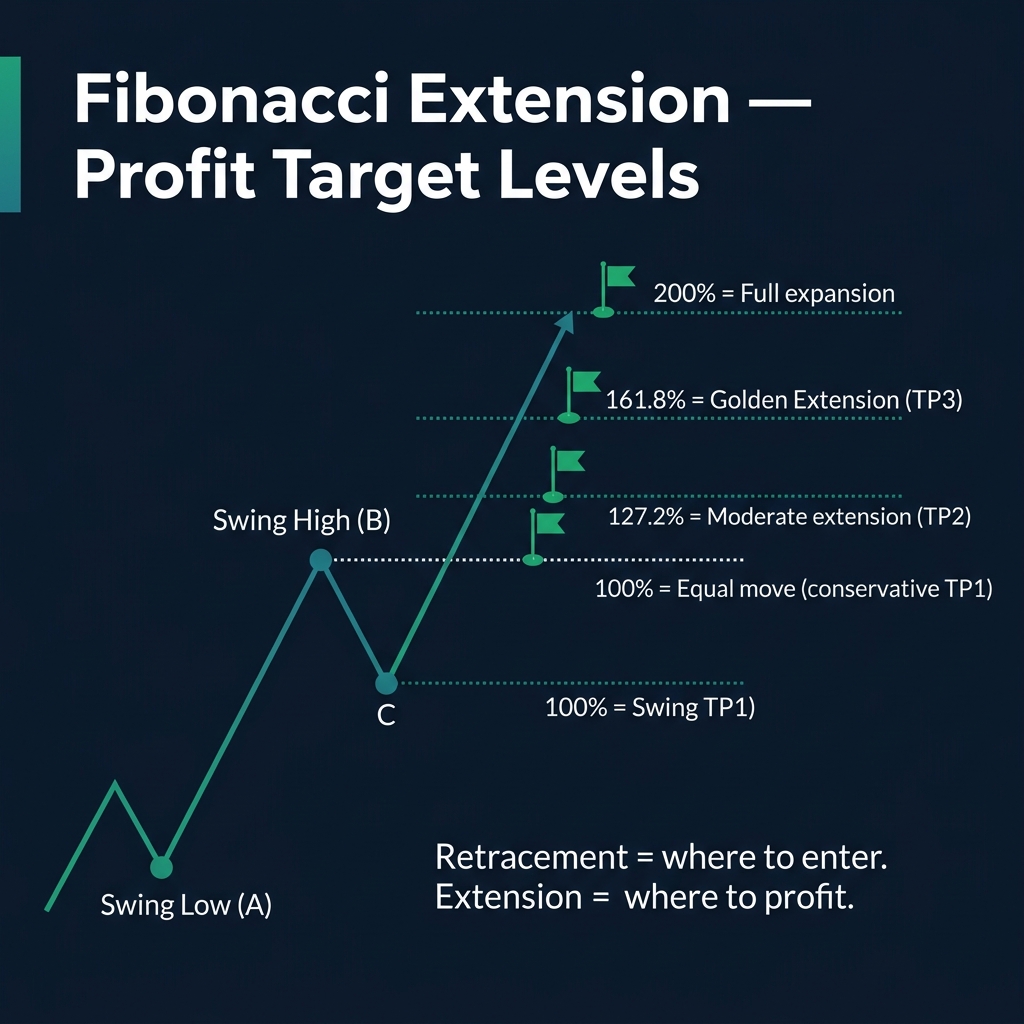
Fibonacci extensions project price targets beyond the original swing high (or low). Here are the key levels:
| Extension Level | What It Means | Best Used As |
|---|---|---|
| 100% | Price travels the same distance as the original impulse | Conservative TP1 |
| 127.2% | Moderate extension, common in choppy trends | TP1 or TP2 |
| 161.8% | The Golden Extension — most-watched level | Primary TP (strong trends) |
| 200% | Full expansion — price doubles the original move | Final TP in parabolic moves |
🎯 Pro tip: The 161.8% extension is the mirror of the 61.8% retracement. If the Golden Ratio pulls price back in, the Golden Extension pushes price forward. They're two sides of the same coin.
The A-B-C Pattern
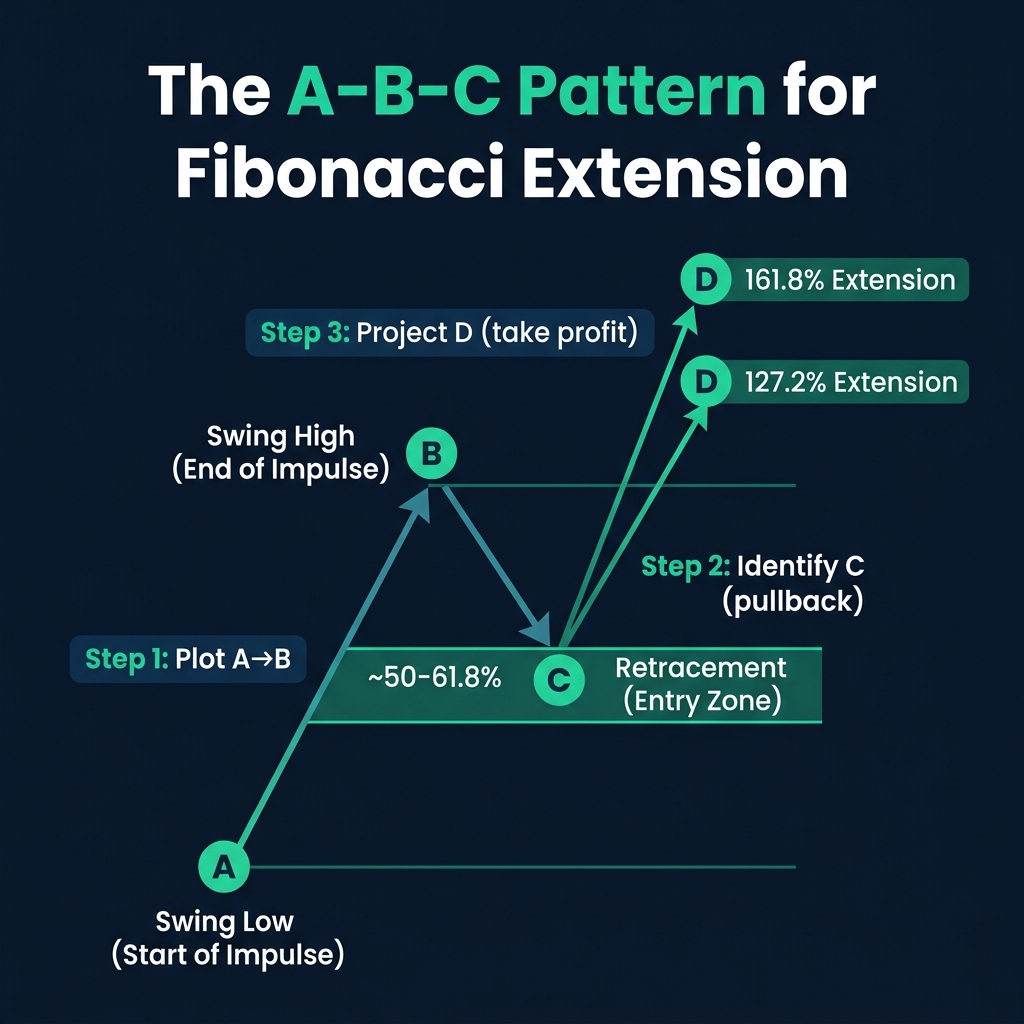
To draw Fibonacci extensions, you need three points:
- Point A — The start of the impulse move (Swing Low in an uptrend)
- Point B — The end of the impulse move (Swing High)
- Point C — The end of the retracement (where price pulls back to)
The tool then projects extension levels beyond Point B, giving you potential take-profit zones labeled as Point D.
Step-by-Step Guide
- Select the Fibonacci Extension tool on your platform (not the retracement tool!)
- Click your three points: A → B → C
- The tool projects 100%, 127.2%, 161.8%, and 200% levels automatically
- Choose your take-profit based on trend strength
How to Choose the Right Take-Profit Level
Not sure whether to target 127.2% or 161.8%? Three factors help you decide:
| Factor | Use 127.2% (Conservative) | Use 161.8% (Aggressive) |
|---|---|---|
| Trend strength | Weakening trend, choppy market | Strong, clean trend with momentum |
| Retracement depth | Deep retracement (61.8%+) = weaker momentum | Shallow retracement (38.2%) = strong momentum |
| Risk appetite | Conservative — lock in profits early | Aggressive — let winners run |
💡 Scale-out strategy: Take 50% profit at 127.2% and let the rest ride to 161.8%. This locks in some gains while giving the trend room to extend.
Retracement vs Extension — Side by Side
| Criteria | Fibonacci Retracement | Fibonacci Extension |
|---|---|---|
| Purpose | Find entry zones during pullbacks | Project take-profit targets |
| Points needed | 2 (swing low + swing high) | 3 (A + B + C) |
| Key levels | 38.2%, 50%, 61.8% | 100%, 127.2%, 161.8%, 200% |
| When to use | Before entering a trade | After entering — to set TP |
Quick Recap
- ✅ Fibonacci extensions project where price could travel after the pullback ends
- ✅ Key levels: 100%, 127.2%, 161.8%, 200%
- ✅ Use the A-B-C pattern (three clicks) to draw extensions
- ✅ Shallow retracement → target 161.8%. Deep retracement → target 127.2%
- ✅ Scale out: 50% at TP1, 50% at TP2 for optimal risk-reward
🎯 Your Action Step
Go back to the EUR/USD trade from the previous lesson. Now apply the Fibonacci Extension tool: click on the swing low (A), the swing high (B), and the retracement point (C). Did price reach the 127.2% or 161.8% extension? This exercise connects entry (retracement) with exit (extension) — the complete Fibonacci trading system.