The $500 Lesson Most Traders Learn the Hard Way
You see price break above resistance. You buy. It looks perfect — breakout confirmed. Then 20 minutes later, price crashes back below the level, rips through your stop loss, and continues falling. You just got faked out. Welcome to the club.
Fakeouts cost traders billions of dollars every year. The irony? If you know how to recognize them, fakeouts become one of the most profitable setups you can trade — because you trade in the opposite direction of the trapped traders.
Why Do Fakeouts Happen?
Fakeouts aren't random market noise. They happen for specific reasons — and understanding why helps you avoid them:
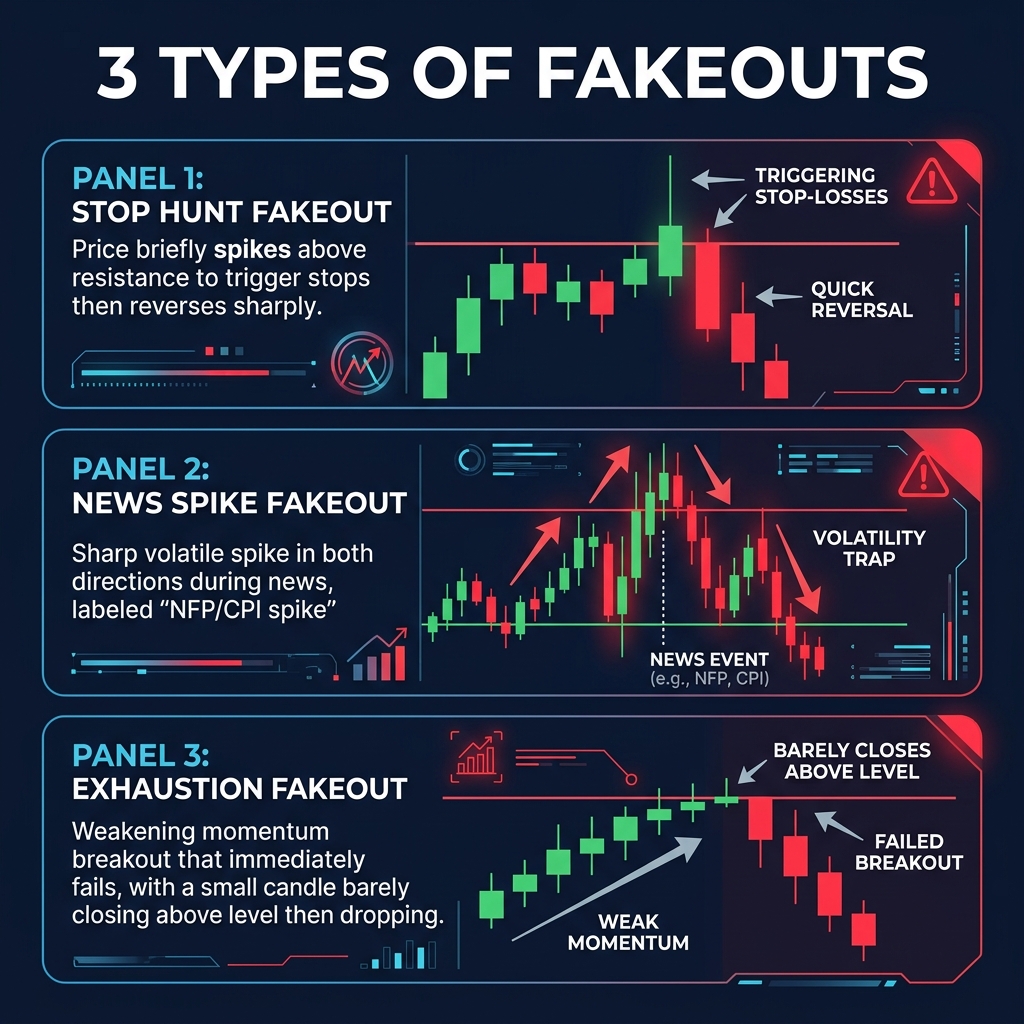
Reason 1: Stop Hunts by Smart Money
Large banks and institutional traders know exactly where retail stop losses cluster — just beyond obvious support and resistance levels. They push price into those zones to trigger the stops, collect the liquidity, then reverse. Your stop loss is their entry price.
Reason 2: News-Driven Spikes
High-impact news (NFP, CPI, FOMC) creates violent spikes that rip through multiple levels in seconds. The initial spike often reverses completely within minutes as the market digests the actual data.
Reason 3: Exhaustion Moves
Sometimes a breakout is the trend's last gasp. The remaining momentum pushes price just beyond a level, but there's no fuel left for follow-through. It immediately fades back.
How to Identify a Fakeout in Real-Time
You can't always avoid fakeouts, but you can dramatically reduce how often they catch you. Look for these red flags:
| Red Flag | What It Means | What to Do |
|---|---|---|
| Long wick, small body | Price was rejected at the level | Wait — the breakout is likely fake |
| Low volume on the break | No conviction behind the move | Skip — real breakouts have above-average volume |
| Break against higher TF trend | Fighting the bigger picture | Fade the breakout (trade in the opposite direction) |
| Break during low-liquidity hours | Asian session false breaks are common | Wait for London/NY session confirmation |
| RSI divergence at the breakout | Momentum doesn't support the move | High probability of fakeout — be cautious |
How to Trade Fakeouts for Profit
The smartest approach to fakeouts isn't just avoiding them — it's trading them. When you identify a fakeout, you enter in the opposite direction, joining the smart money.
The Fakeout Reversal Setup
- Identify key level — a strong S/R zone with multiple touches
- Watch the "breakout" — price pushes beyond the level
- Spot the rejection — candle closes back inside the range (long wick beyond level, body inside)
- Enter on the next candle — in the opposite direction of the fake breakout
- Stop loss: Beyond the fakeout wick extreme + 10 pip buffer
- Target: The opposite side of the range, or 1:2 R:R minimum
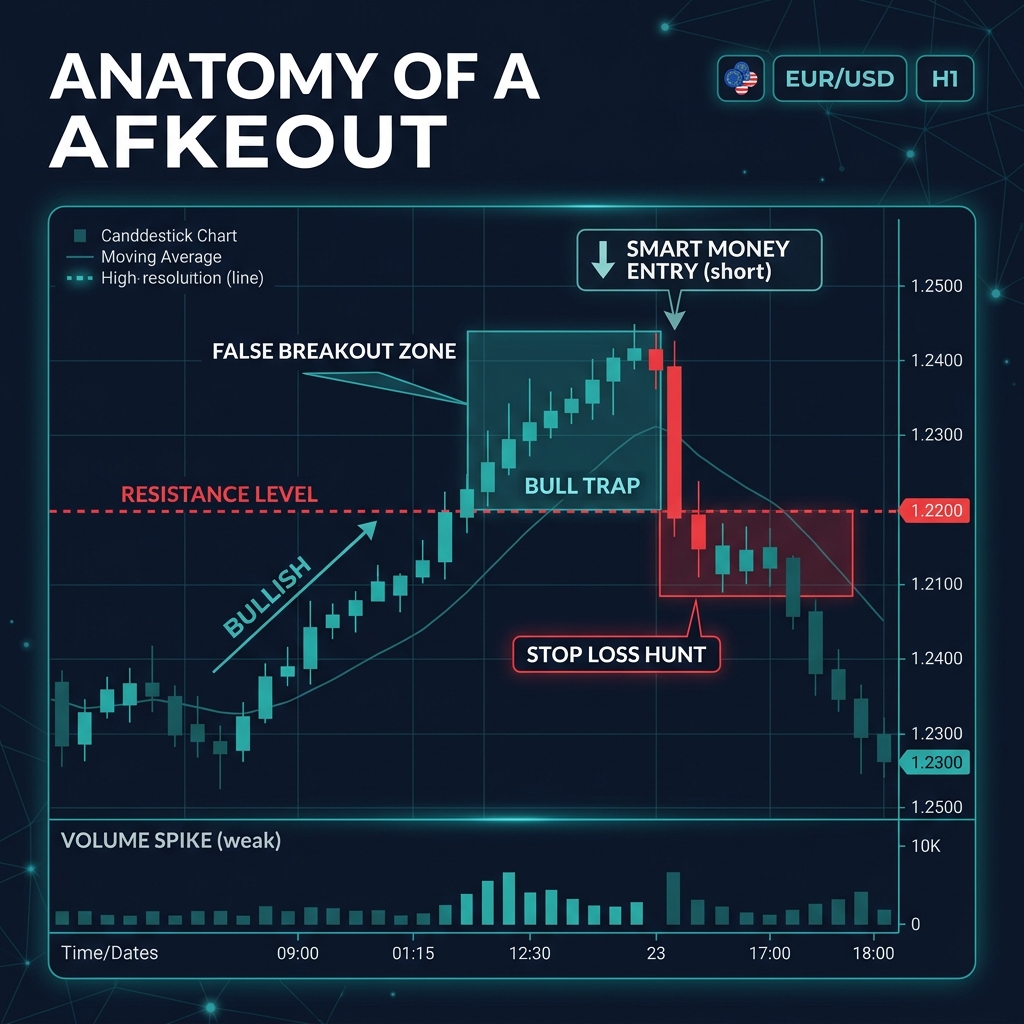
Real example — Fakeout reversal on EUR/USD H1:
- Resistance at 1.0920 tested 3 times
- Price spikes to 1.0938 during Asian session (low volume)
- Candle closes at 1.0912 — full rejection, long upper wick
- RSI shows bearish divergence at the breakout ✅
- Enter short: 1.0910 | Stop: 1.0945 (35 pips) | Target: 1.0855 (55 pips)
- R:R = 1:1.6 | Price hit target in London session ✅
The 3-Candle Rule
If you're unsure whether a breakout is real, use the 3-candle rule: wait for 3 candles to close beyond the breakout level. If all 3 close on the breakout side, the breakout is likely real. If any of the 3 close back inside the range, it's probably a fakeout.
This rule will cause you to miss some trades, but the ones you take will have significantly higher win rates.
Quick Recap
- Fakeouts happen because of stop hunts, news spikes, and exhaustion moves
- Red flags: long wicks, low volume, against higher TF trend, during low-liquidity sessions
- Don't just avoid fakeouts — trade them by entering opposite the trapped traders
- The 3-candle rule filters out most fakeouts at the cost of some missed moves
- RSI divergence at a breakout point is a strong fakeout warning
🎯 Your Action Step
Go back to the consolidation zone you marked in the previous lesson's action step. Now look for fakeouts — times when price briefly broke beyond the level then reversed. How many of the breakout attempts were actually fakeouts? What was the red flag each time (wick, volume, session timing)? This teaches you to see traps before you step in them.