The Pattern Behind Every Market Move
In the 1930s, an accountant named Ralph Nelson Elliott discovered something remarkable: markets don't move randomly. They move in repeating wave patterns driven by crowd psychology. Decades later, this discovery — now called Elliott Wave Theory — remains one of the most powerful (and most misunderstood) tools in a trader's arsenal.
The core idea is simple: markets move in 5 waves in the direction of the trend, followed by 3 waves of correction. That's it. The 5-3 pattern. It happens on every timeframe, in every market, because human emotions (fear and greed) follow the same cycle every time.
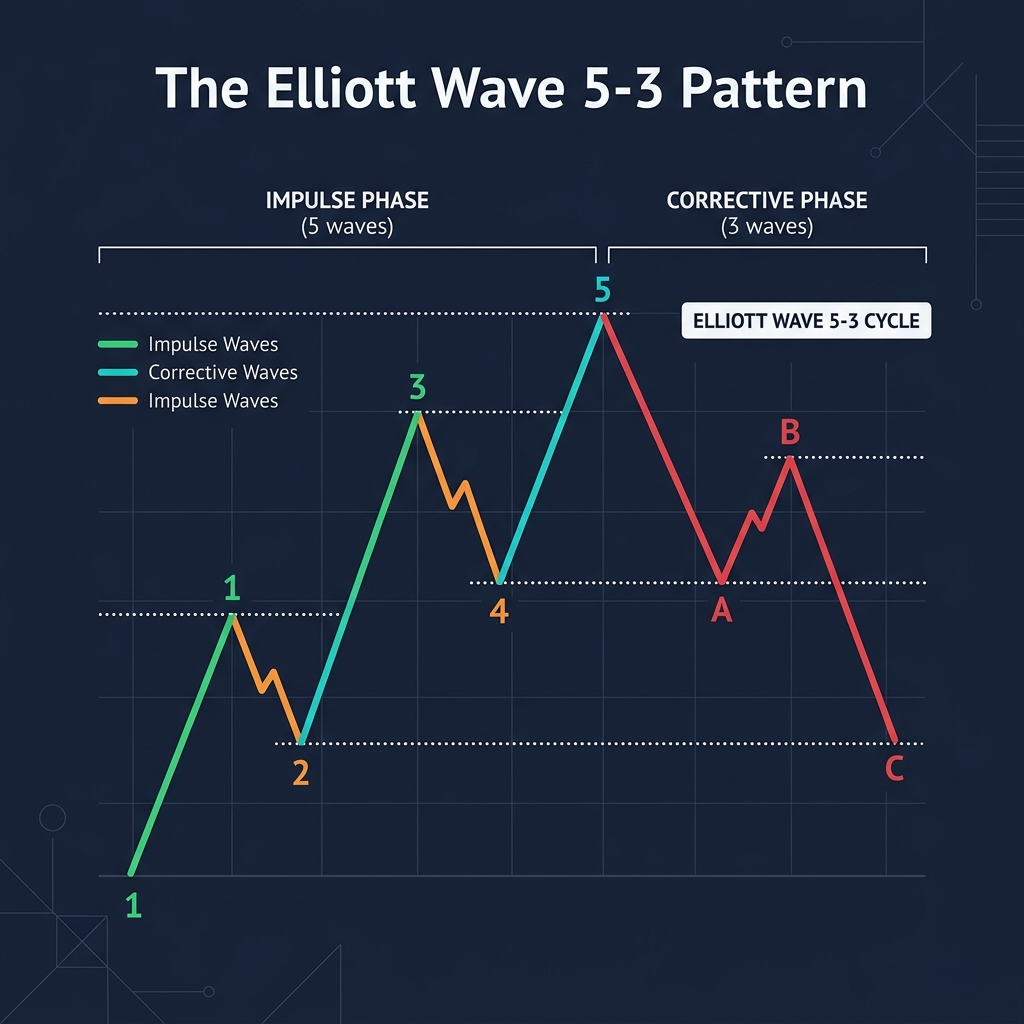
The 5 Impulse Waves
The impulse phase moves in the direction of the main trend. In an uptrend, it looks like this:
Wave 1: The Breakout
The first move up. Most traders don't notice it yet. A small group of informed traders (or institutions) starts buying. The move is often attributed to luck or noise. Volume is moderate.
Wave 2: The Skeptic's Pullback
Price pulls back, and bears think the old downtrend is resuming. But Wave 2 never retraces beyond the start of Wave 1 — this is an absolute rule. Typically retraces 50-61.8% of Wave 1. Volume decreases on this pullback.
Wave 3: The Power Move
This is the strongest and longest wave. The crowd finally recognizes the new trend and piles in. Fundamental news confirms the move. Volume surges. Wave 3 is never the shortest of waves 1, 3, and 5 — another absolute rule. This is where the real money is made.
Wave 4: The Complacency Pullback
Profit-taking creates a pullback, but the uptrend remains intact. Wave 4 is typically shallow (38.2% retracement of Wave 3) and never overlaps with Wave 1's territory — the third absolute rule. Volume decreases again.
Wave 5: The Final Push
The last leg of the impulse. Late buyers enter — FOMO kicks in. Volume often diverges (price makes new high, but volume is lower than Wave 3). Divergence signals on RSI and MACD frequently appear here. Smart money starts selling to the latecomers.
The 3 Corrective Waves (A-B-C)
After the 5-wave impulse, the market corrects with a 3-wave pattern:
Wave A: The Warning
The first significant drop. Many traders think it's just another pullback and buy. Volume starts increasing on the downside.
Wave B: The Bull Trap
A counter-rally that gives false hope. Price partially recovers, and optimists think the uptrend is continuing. But volume is typically weak. This is a trap.
Wave C: The Cleanup
The final corrective wave. It's often as strong as Wave 3 but in the opposite direction. Panic selling occurs. The crowd capitulates. This is where the new cycle begins for smart buyers.
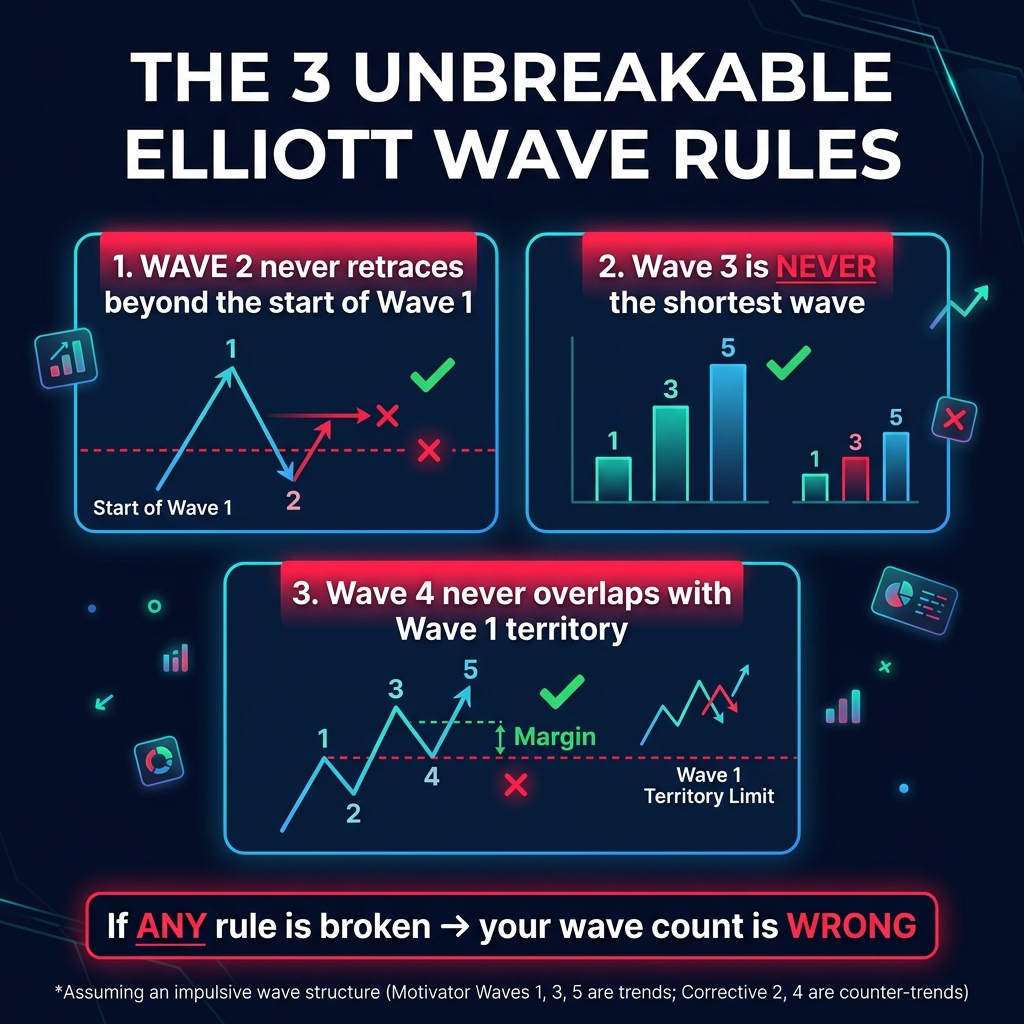
The 3 Unbreakable Rules
Elliott Wave has only 3 rules that can never be broken. If any of these are violated, your wave count is wrong:
| Rule | Description | Why It Matters |
|---|---|---|
| Rule 1 | Wave 2 never retraces 100% of Wave 1 | If it does, the trend never actually started |
| Rule 2 | Wave 3 is never the shortest impulse wave | Wave 3 has the most participation and momentum |
| Rule 3 | Wave 4 never enters Wave 1 territory | Overlap means the structure is corrective, not impulsive |
Helpful Guidelines (Not Rules)
Unlike the 3 rules, these guidelines are frequently observed but can be broken:
- Wave 2 typically retraces 50-61.8% of Wave 1
- Wave 3 is often 1.618x the length of Wave 1 (Fibonacci extension)
- Wave 4 typically retraces 38.2% of Wave 3
- Wave 5 is often equal in length to Wave 1
- Wave A and C are often equal in length
- Alternation: If Wave 2 is sharp, Wave 4 tends to be flat (and vice versa)
Real-World Application — Why You Should Care
You don't need to become an Elliott Wave purist. But understanding the 5-3 structure gives you:
- Context: "We're likely in Wave 3 — this trend has legs, don't fade it"
- Warning signals: "Wave 5 with RSI divergence — the move is almost over"
- Entry points: "Wave 2 pullback to 61.8% Fibonacci — classic buy zone"
- Expectations: "After the A-B-C correction, a new impulse should begin"
Quick Recap
- Markets move in 5 impulse waves + 3 corrective waves
- Wave 3 is the power move — strongest, longest, highest volume
- Wave 5 is the final push — often shows divergence signals
- A-B-C correction follows the impulse — Wave B is the classic bull/bear trap
- 3 absolute rules: Wave 2 < 100% of Wave 1, Wave 3 ≠ shortest, Wave 4 ≠ overlap Wave 1
🎯 Your Action Step
Open USD/JPY on the Daily chart. Find a recent clear trend (up or down) that lasted at least 2-3 months. Try to label the 5 impulse waves. Does Wave 3 look like the longest/strongest? Does Wave 5 show any divergence? Don't worry about perfect labeling — just practice seeing the 5-3 pattern in real market data.