The Pattern That Started It All
If chart patterns had a "greatest hits" album, the Double Top and Double Bottom would be track one. They're the most common reversal patterns in trading — and the first ones every serious trader should master.
A Double Top looks like the letter "M" and signals the end of an uptrend. A Double Bottom looks like the letter "W" and signals the end of a downtrend. Simple shapes, powerful implications.
The Anatomy of Double Top & Double Bottom
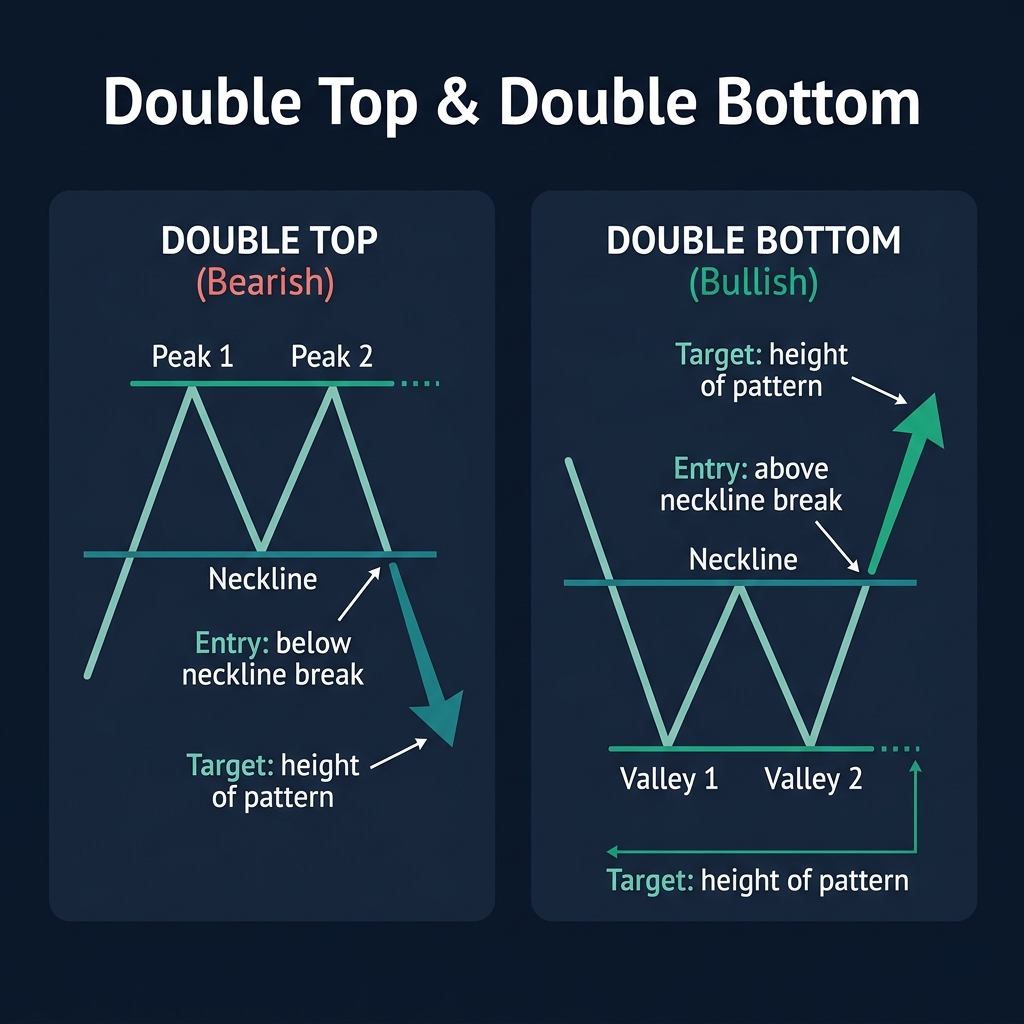
Double Top (Bearish Reversal)
- Price rises in an uptrend and hits a peak (Peak 1)
- Price pulls back to a support level — this becomes the neckline
- Price rallies again but fails to break above Peak 1 — forming Peak 2
- Price drops and breaks below the neckline → Reversal confirmed
Key insight: The second peak failing to break the first tells you that buying pressure is exhausting. The bulls tried twice and couldn't push higher — now the bears take control.
Double Bottom (Bullish Reversal)
- Price falls in a downtrend and hits a valley (Valley 1)
- Price bounces up to a resistance level — this becomes the neckline
- Price drops again but fails to break below Valley 1 — forming Valley 2
- Price rises and breaks above the neckline → Reversal confirmed
💡 The pattern is NOT complete until the neckline breaks. Two peaks or valleys alone are just price action — the neckline break is what makes it a tradeable pattern.
How to Trade It
Entry Strategy
There are two approaches:
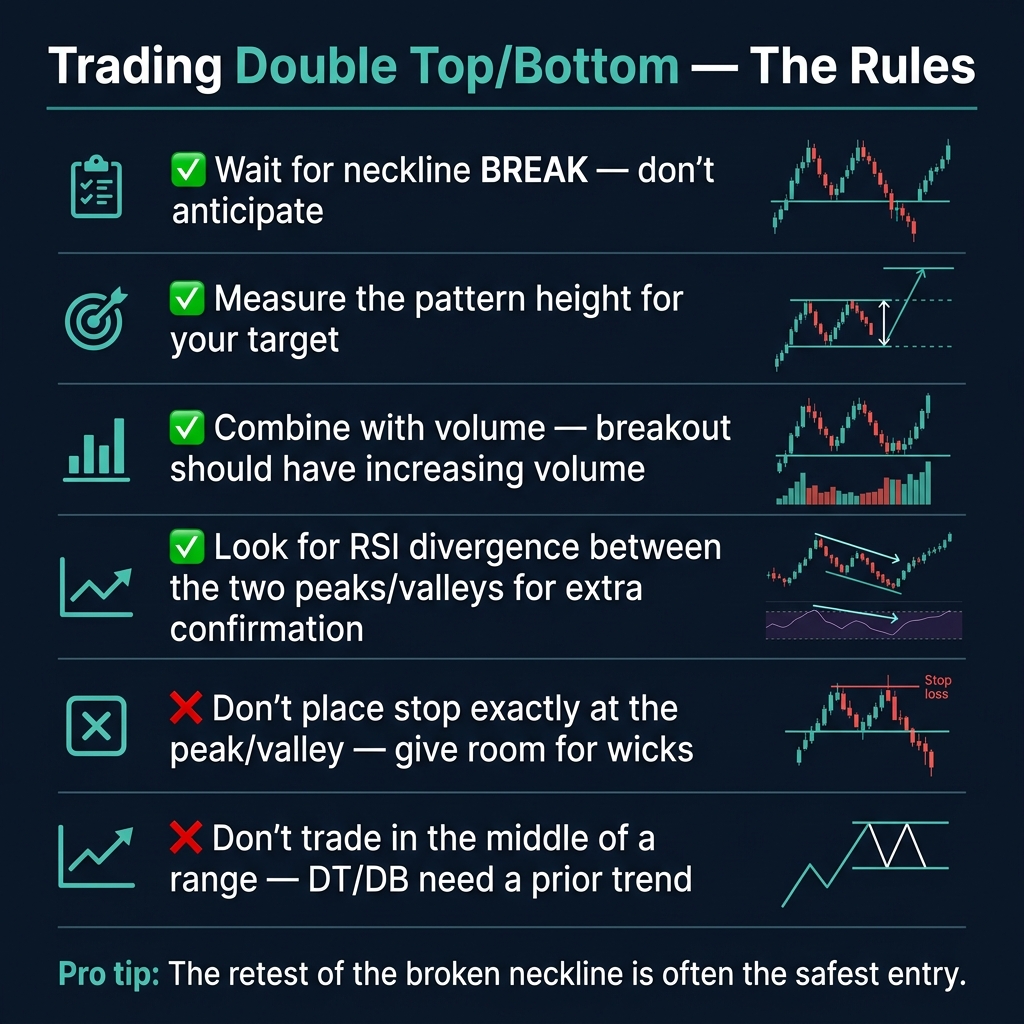
- Aggressive: Enter on the neckline break with a close below/above it
- Conservative (recommended): Wait for the retest of the broken neckline. Price often comes back to test the neckline as new resistance (Double Top) or support (Double Bottom) before continuing
Stop Loss
- Double Top: Stop above Peak 2 (with a small buffer for wicks)
- Double Bottom: Stop below Valley 2 (with a small buffer)
Profit Target
Measure the height of the pattern (distance from peaks to neckline) and project that distance from the neckline breakout point.
Bonus Confirmation
- RSI divergence between Peak 1 and Peak 2 → Extra confirmation that momentum is fading
- Volume decreasing on the second peak/valley → The move is losing steam
Common Mistakes
| Mistake | Why It's Wrong | Fix |
|---|---|---|
| Entering before neckline breaks | Pattern isn't confirmed yet — could be a range | Wait for neckline break + close |
| Trading without a prior trend | DT/DB are reversal patterns — they need a trend to reverse | Only look for DT after an uptrend, DB after a downtrend |
| Stop too tight at the peak | Wicks often spike above/below before reversing | Add 10-20 pip buffer above/below the peak |
Quick Recap
- ✅ Double Top = M-shape = bearish reversal after an uptrend
- ✅ Double Bottom = W-shape = bullish reversal after a downtrend
- ✅ Pattern is only confirmed when neckline breaks
- ✅ Measure pattern height for profit target
- ✅ The neckline retest is often the safest entry point
🎯 Your Action Step
Open EUR/USD or GBP/USD on the H4 chart. Find one Double Top and one Double Bottom in the past 3 months. Mark the neckline, measure the pattern height, and see if the target was hit after the breakout. This exercise will train your eyes to spot these patterns in real time.