When the Market Pauses to Think
Not every candle signals a strong move. Sometimes the market just... can't decide. Buyers and sellers fight to a draw. Price opens and closes at nearly the same level. Nobody wins.
These are indecision candles — and they're just as important as reversal patterns. Why? Because indecision at a key level often precedes a big move. The market is coiling like a spring, and the next candle tells you which direction it'll snap.
In this lesson, you'll learn to read Doji, Spinning Top, and other indecision patterns — and understand why they matter more than most traders think.
The Doji Family
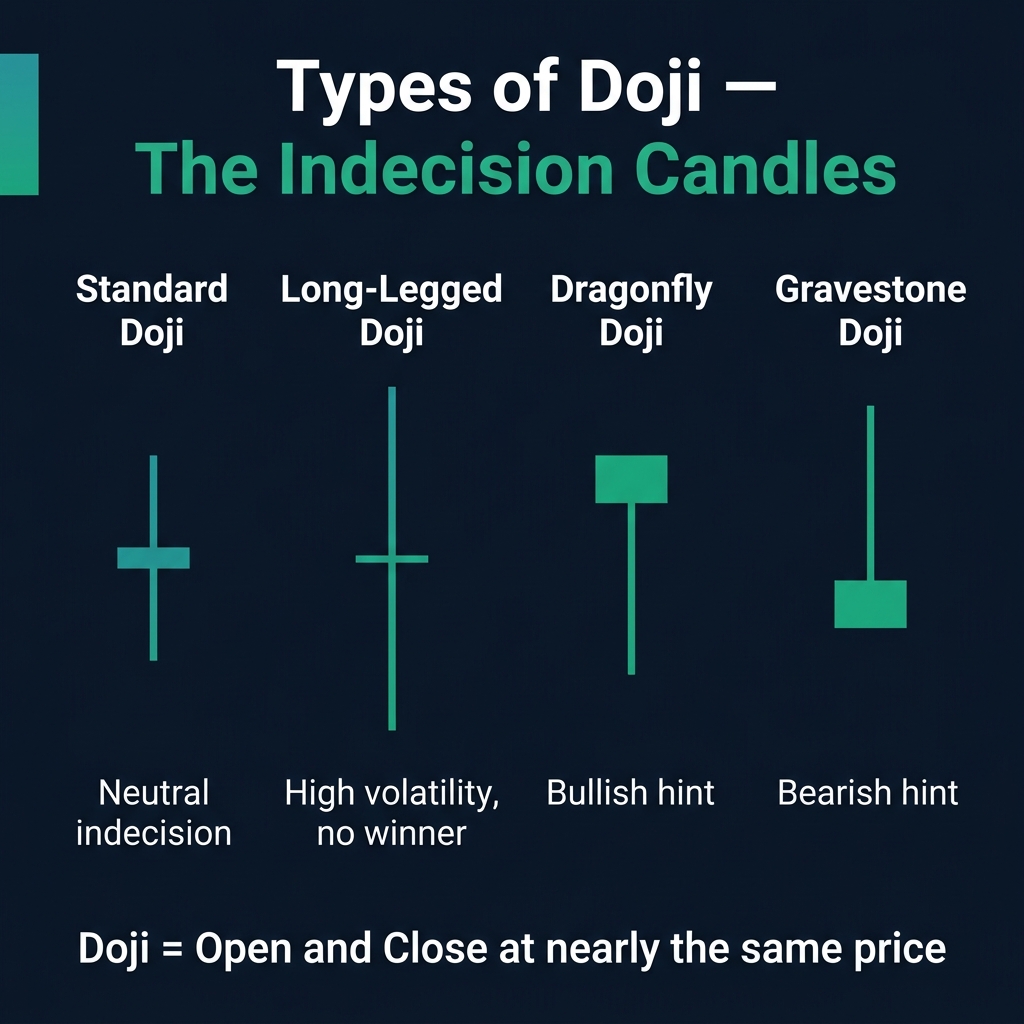
A doji forms when the opening and closing prices are virtually the same, creating a candle with little to no body. There are four common types:
1. Standard Doji
The classic cross shape. Equal wicks on both sides, tiny body in the middle. This is pure indecision — buyers and sellers are perfectly balanced.
2. Long-Legged Doji
Very long wicks on both sides. This shows extreme volatility within the session — price swung wildly up and down, but ended right where it started. The longer the legs, the more intense the battle.
3. Dragonfly Doji
Long lower wick, no upper wick. Sellers pushed price down hard, but buyers fought back completely. This is slightly bullish — similar to a hammer, but with an even smaller body. Most significant at the bottom of a downtrend.
4. Gravestone Doji
Long upper wick, no lower wick. The opposite of a dragonfly. Buyers tried to push higher, but sellers slammed the door shut. Slightly bearish — most significant at the top of an uptrend.
The Spinning Top
A spinning top is like a doji's cousin — it has a slightly wider body, but the key feature is long wicks on both sides that are longer than the body.
- What it means: The market is indecisive, but less so than a pure doji
- Where it matters: After a strong trend — it signals the trend may be losing momentum
- What to do: Wait for the next candle to confirm direction
💡 Doji vs Spinning Top: A doji has almost no body. A spinning top has a small body. Both signal indecision, but a doji is a stronger signal of uncertainty.
Context Changes Everything
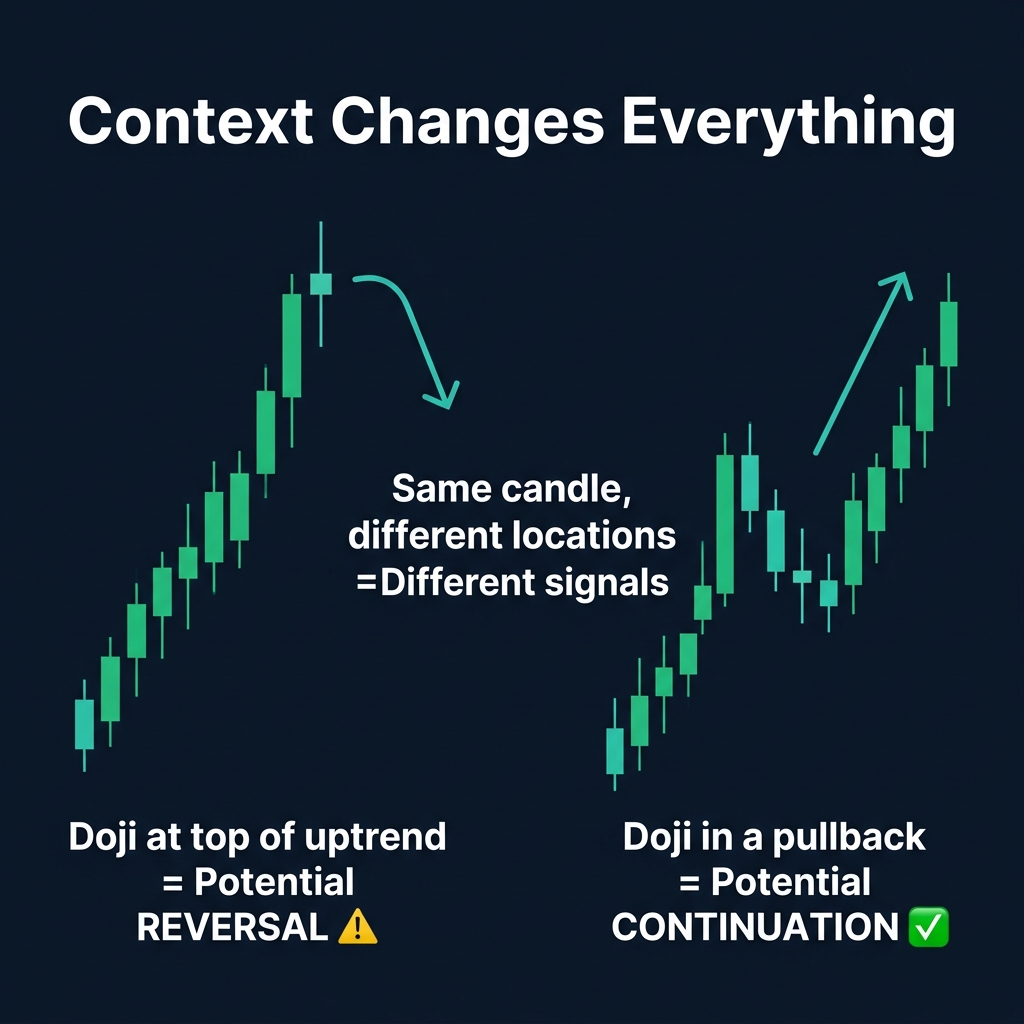
Here's the critical truth about indecision candles: the candle itself means nothing. Its location means everything.
| Location | Signal | Likely Outcome |
|---|---|---|
| Doji at resistance after uptrend | Bearish reversal likely | Wait for red confirmation candle → sell |
| Doji at support after downtrend | Bullish reversal likely | Wait for green confirmation candle → buy |
| Doji in the middle of a range | No clear signal | Stay out — wait for better setup |
| Doji during a pullback in an uptrend | Continuation likely | The trend may resume after the pause |
🎯 The rule: An indecision candle at a key level → reversal signal. An indecision candle during a pullback → continuation signal. An indecision candle in no-man's-land → ignore it.
How to Trade Indecision Candles
- Never trade the indecision candle itself — it tells you something is about to happen, not what will happen
- Wait for the confirmation candle — the candle AFTER the doji decides the direction
- Use the doji's extremes as stop-loss levels — if going long, stop below the doji's low; if going short, stop above the doji's high
- Best on Daily and H4 timeframes — doji on M5 are too noisy to be reliable
Quick Recap
- ✅ Doji = open and close at the same price → buyers and sellers are balanced
- ✅ 4 types: Standard, Long-Legged, Dragonfly (bullish hint), Gravestone (bearish hint)
- ✅ Spinning Top = small body with long wicks → weaker indecision signal
- ✅ Context is king — same candle means different things at different locations
- ✅ Never trade the doji alone — always wait for the confirmation candle
🎯 Your Action Step
On any Daily chart, find 3 doji candles that appeared at key S&R levels. For each one, check the candle that followed. Did it confirm a reversal? Did the trend continue? This exercise trains your eye to see that the doji is the warning shot, and the next candle is the trigger.