Where Multiple Tools Point to the Same Price
You've learned Fibonacci retracement and extension. You've mastered support and resistance from Level 4. Now it's time for the ultimate upgrade: combining them together to find confluence zones — price areas where multiple tools agree.
Professional traders don't rely on a single indicator. They build a case, like a detective gathering evidence. When Fibonacci levels, S&R zones, moving averages, and candlestick patterns all point to the same price area, the probability of a successful trade skyrockets.
What Is a Confluence Zone?
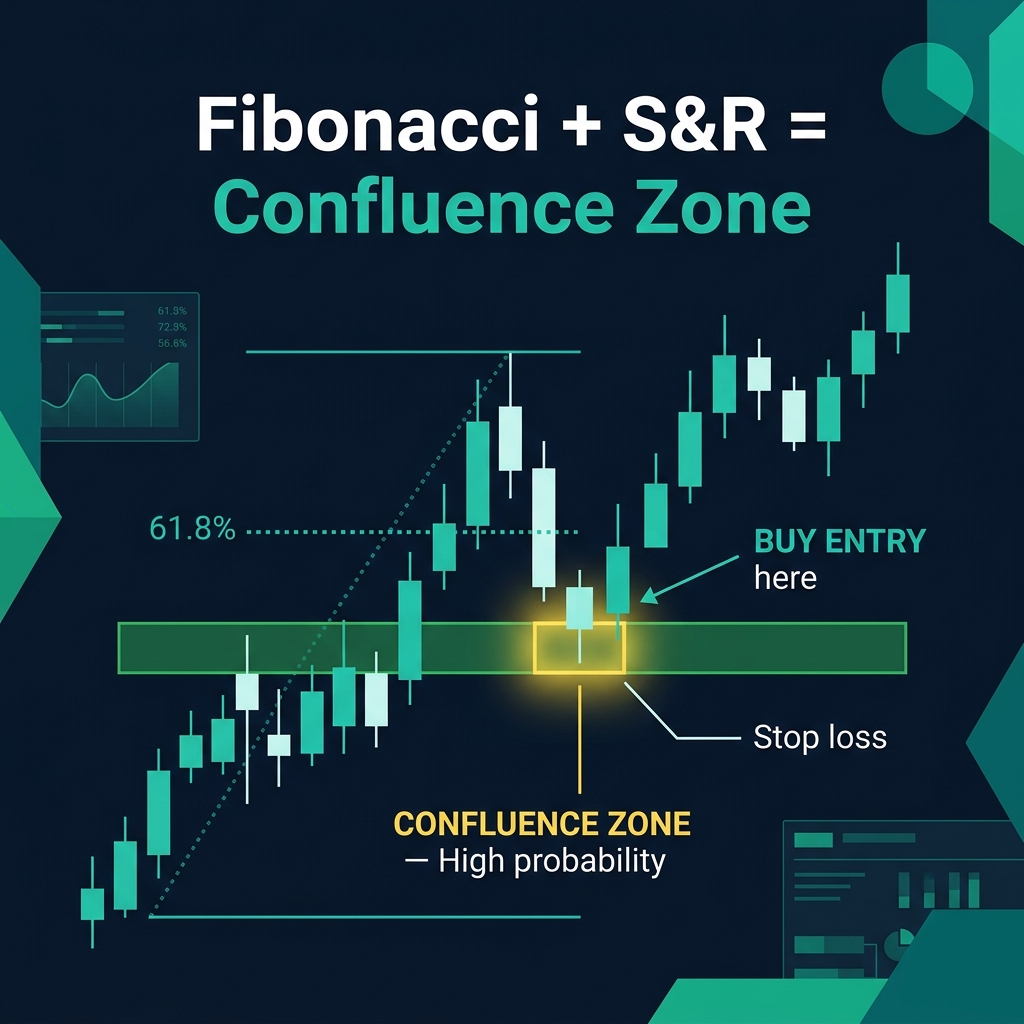
A confluence zone is a price area where two or more independent technical tools line up at the same level. Think of it like GPS navigation: one satellite gives you a rough position. Three satellites give you a precise location.
The most powerful confluence combinations with Fibonacci:
| Fibonacci Level | Combined With | Why It Works |
|---|---|---|
| 61.8% retracement | Horizontal S&R | Two types of traders (Fib + S&R) are watching the same price |
| 50% retracement | 200-period MA | Fibonacci + dynamic S&R = double support |
| 38.2% retracement | Trend line | Pullback to trend line + Fibonacci = trend continuation signal |
| 61.8% retracement | Psychological level (round number) | Golden Ratio + human psychology = powerful barrier |
🧠 Why confluence works: Each tool represents a different group of traders. S&R traders, Fibonacci traders, moving average traders — when they all see the same level, their combined orders create a wall of buying or selling pressure.
The Power of Stacking
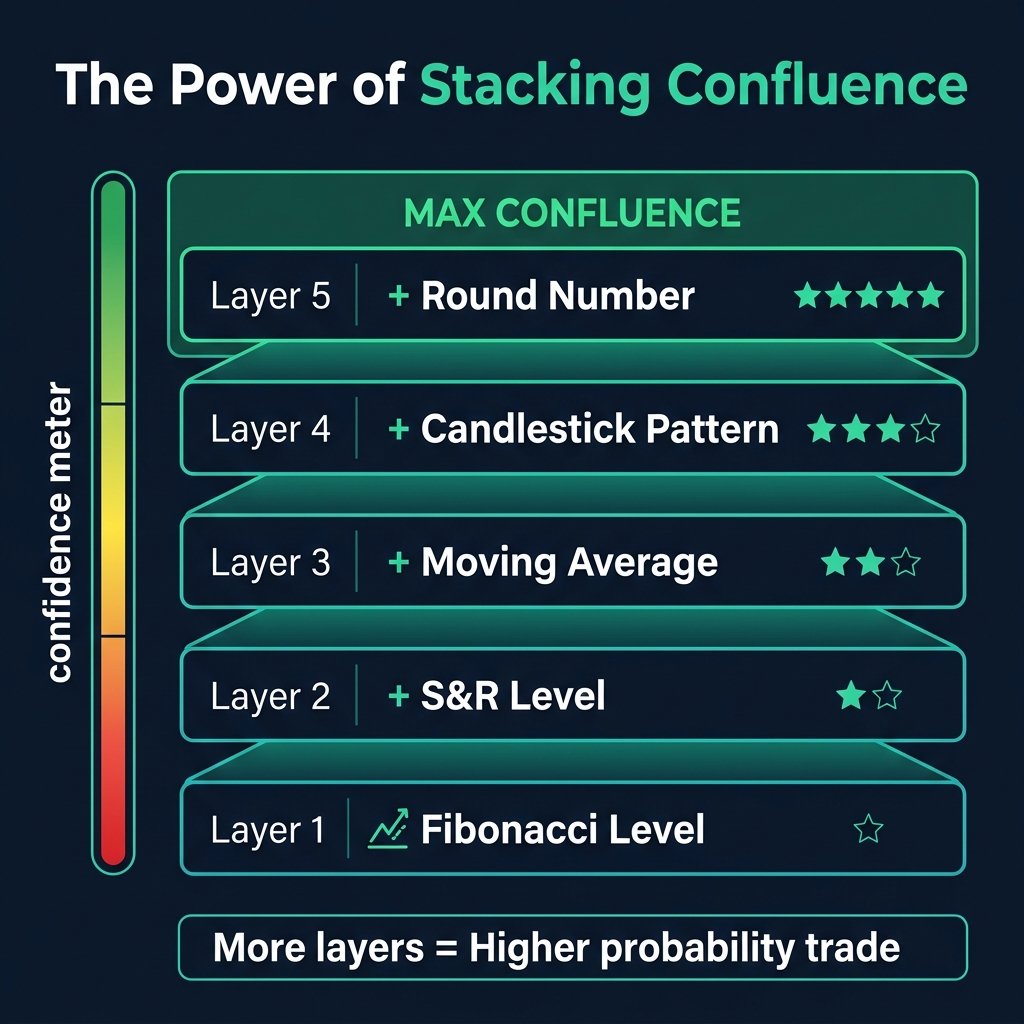
Here's how to grade your setups by the number of confluence factors:
| Factors | Rating | Action |
|---|---|---|
| ⭐ 1 (Fibonacci only) | Weak | Do NOT trade — need more evidence |
| ⭐⭐ 2 (Fib + S&R) | Moderate | Watch closely, wait for confirmation candle |
| ⭐⭐⭐ 3 (Fib + S&R + MA) | Strong | Good setup — look for entry with proper risk |
| ⭐⭐⭐⭐ 4 (Fib + S&R + MA + Candle) | Very Strong | Take the trade with confidence |
| ⭐⭐⭐⭐⭐ 5 (All + Round Number) | A-Grade | Maximum conviction — this is what pros wait for |
The Complete Confluence Trading Process
- Draw your S&R levels on the Daily/H4 chart first
- Apply Fibonacci retracement to the most recent impulse move
- Look for overlap — does a Fibonacci level land on or near an S&R zone?
- Check for additional factors: Is a moving average nearby? A trend line? A round number?
- Wait for a candlestick signal at the confluence zone (hammer, engulfing, doji)
- Enter in the direction of the trend. Stop loss beyond the zone. Take profit using Fibonacci extensions.
🎯 The workflow: S&R + Fibonacci → identify the zone. Candlestick pattern → confirm the entry. Fibonacci extension → set the target. Risk management → protect your capital.
Common Mistakes with Fibonacci Confluence
- "I see Fibonacci and S&R near each other — close enough!" — "Near" isn't confluence. The levels should overlap within 10-15 pips
- "I drew 5 Fibonacci retracements on different swings" — Use one clear, major swing. Multiple Fibonacci drawings create confusion, not clarity
- "I'll trade the confluence zone without a candlestick signal" — The zone tells you WHERE. The candle tells you WHEN. You need both
- "Fibonacci works in every market condition" — Fibonacci + S&R confluence works best in trending markets. Avoid during choppy ranges
Quick Recap
- ✅ Confluence = multiple tools agreeing at the same price level
- ✅ Best combo: Fibonacci + S&R + Moving Average + Candlestick
- ✅ More confluence factors = higher probability trade
- ✅ Always wait for confirmation — confluence tells you WHERE, the candle tells you WHEN
- ✅ Use Fibonacci Extensions to set your take-profit after entering at the confluence zone
🎯 Your Action Step
On a GBP/USD Daily chart, draw your key S&R levels. Then apply Fibonacci retracement to the last major swing. Find a price area where a Fibonacci level (38.2%, 50%, or 61.8%) aligns with an S&R zone. That's your confluence zone. Now check: was there a candlestick signal at that level? This is how A-grade setups look.
Module 1 complete! → Take the Fibonacci quiz to test your knowledge and earn your Golden Ratio certificate.