When Sellers Lose Control — The Buyer's Comeback
Price has been falling. Bears are in control. The chart looks ugly. And then — a single candle or a sequence of candles appears that tells you: the sellers just ran out of steam.
These are bullish reversal candlestick patterns — the signals that buyers are about to take over. Learn to spot them, and you'll be positioned at the exact moment the market turns.
In this lesson, you'll master the three most reliable bullish reversal patterns: the Hammer, the Bullish Engulfing, and the Morning Star.
The 3 Bullish Reversal Patterns You Must Know
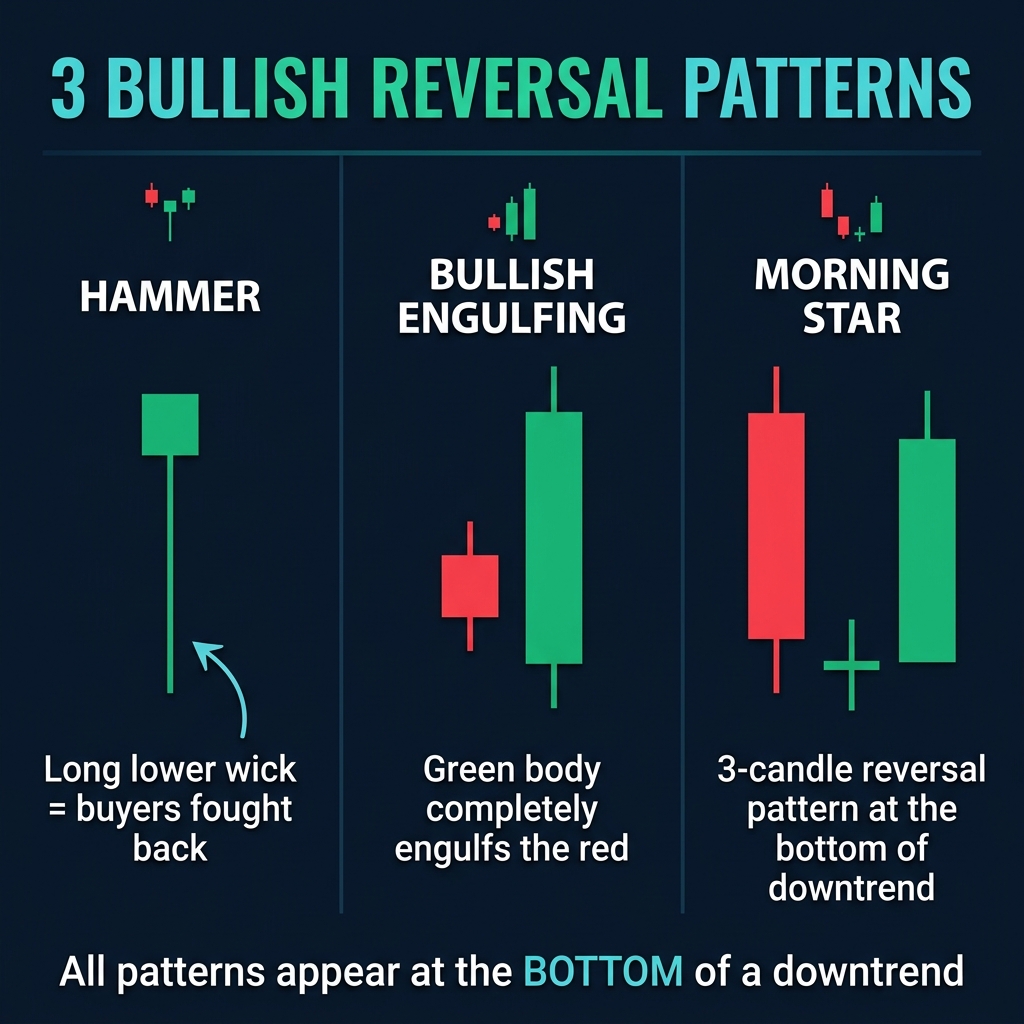
1. The Hammer
The hammer is a single-candle pattern that appears at the bottom of a downtrend. It looks like a lollipop — small body at the top, long lower wick.
| Feature | What to Look For |
|---|---|
| Body | Small, positioned at the top of the candle |
| Lower wick | At least 2x the length of the body |
| Upper wick | Little to none |
| Color | Green is stronger, but red hammers still valid |
| Location | Must appear after a downtrend |
What it tells you: Sellers pushed price down hard during the session. But then buyers stepped in with force, pushing price all the way back up to near the open. The long lower wick = buyer rejection of lower prices.
⚠️ Confirmation required: A hammer alone isn't enough. Wait for the next candle to close green before entering.
2. Bullish Engulfing
A two-candle pattern where a small red candle is followed by a large green candle that completely "engulfs" the previous candle's body.
- Candle 1: Small red body (sellers are weakening)
- Candle 2: Large green body that opens below the previous close and closes above the previous open
What it tells you: Sellers made their move, but buyers overwhelmed them completely. The bigger the engulfing candle relative to the previous one, the stronger the signal.
3. Morning Star
The most powerful bullish reversal — a three-candle pattern:
- Long red candle — Downtrend continues, sellers in control
- Small body candle (doji or spinning top) — Indecision. Neither buyers nor sellers won
- Long green candle — Buyers take over. The reversal begins
What it tells you: The market went from certainty (sellers winning), to doubt (indecision), to a new direction (buyers winning). This three-act story makes the morning star one of the most reliable reversal signals.
Where These Patterns Work Best
A bullish reversal candle in the middle of a chart means nothing. Context is everything. These patterns are only powerful when they appear at the right location:
- ✅ At a support zone (horizontal S&R)
- ✅ On an uptrend line (dynamic support)
- ✅ At a psychological level (round number like 1.1000)
- ✅ At a previous resistance turned support (polarity)
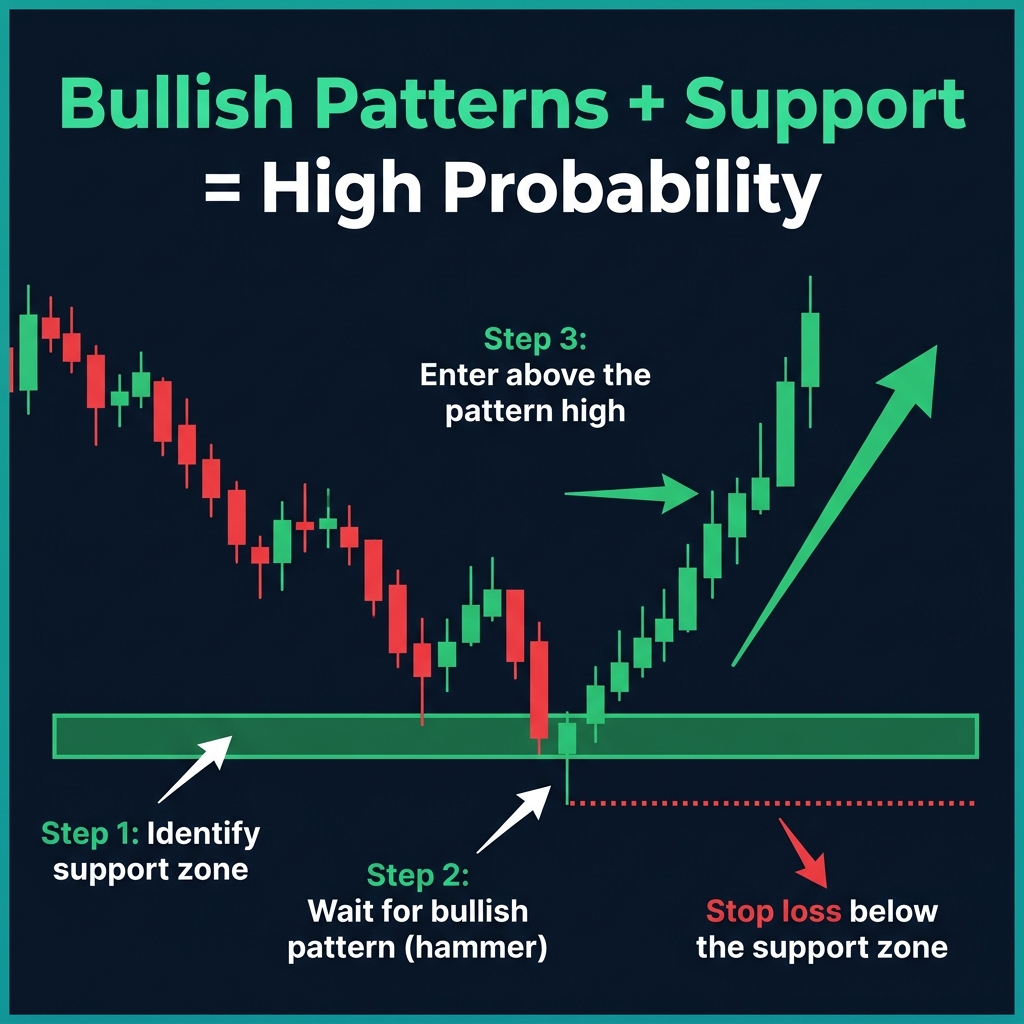
A hammer at random = weak signal. A hammer at support = high-probability trade.
🎯 The formula: KEY LEVEL + BULLISH PATTERN + CONFIRMATION = Entry signal
How to Trade Bullish Reversals
| Step | Action |
|---|---|
| 1. Identify the trend | Price must be in a downtrend or pulling back |
| 2. Find a key level | Support zone, trend line, or psychological level |
| 3. Spot the pattern | Hammer, engulfing, or morning star at the level |
| 4. Wait for confirmation | Next candle closes green (above the pattern) |
| 5. Enter | Buy above the pattern's high |
| 6. Stop loss | Below the pattern's low (or below the support zone) |
| 7. Take profit | Next resistance level or 1:2 R:R minimum |
Quick Recap
- ✅ Hammer = single candle, long lower wick, at the bottom of a downtrend
- ✅ Bullish Engulfing = green candle completely covers the previous red candle
- ✅ Morning Star = 3 candles: red → indecision → green (strongest signal)
- ✅ Location matters most — only trade these at key support levels
- ✅ Always wait for confirmation before entering
🎯 Your Action Step
On your EUR/USD Daily chart, scroll back through the last 6 months. Find 3 examples of bullish reversal candles (hammer, engulfing, or morning star) that appeared at a support level you already drew. Did price reverse? How far did it go? This exercise connects everything you've learned so far.