Stop Using Indicators Randomly
Here's a truth that took most traders years to learn: one indicator is never enough, and five indicators is too many. The sweet spot? Three — each from a different category, forming a single, unified signal.
This is called an indicator stack — a systematic way to combine 3 tools that answer 3 different questions. When all three agree, you have a high-probability trade. When they disagree, you stay out. Simple, powerful, and repeatable.
The 3-Layer Stack
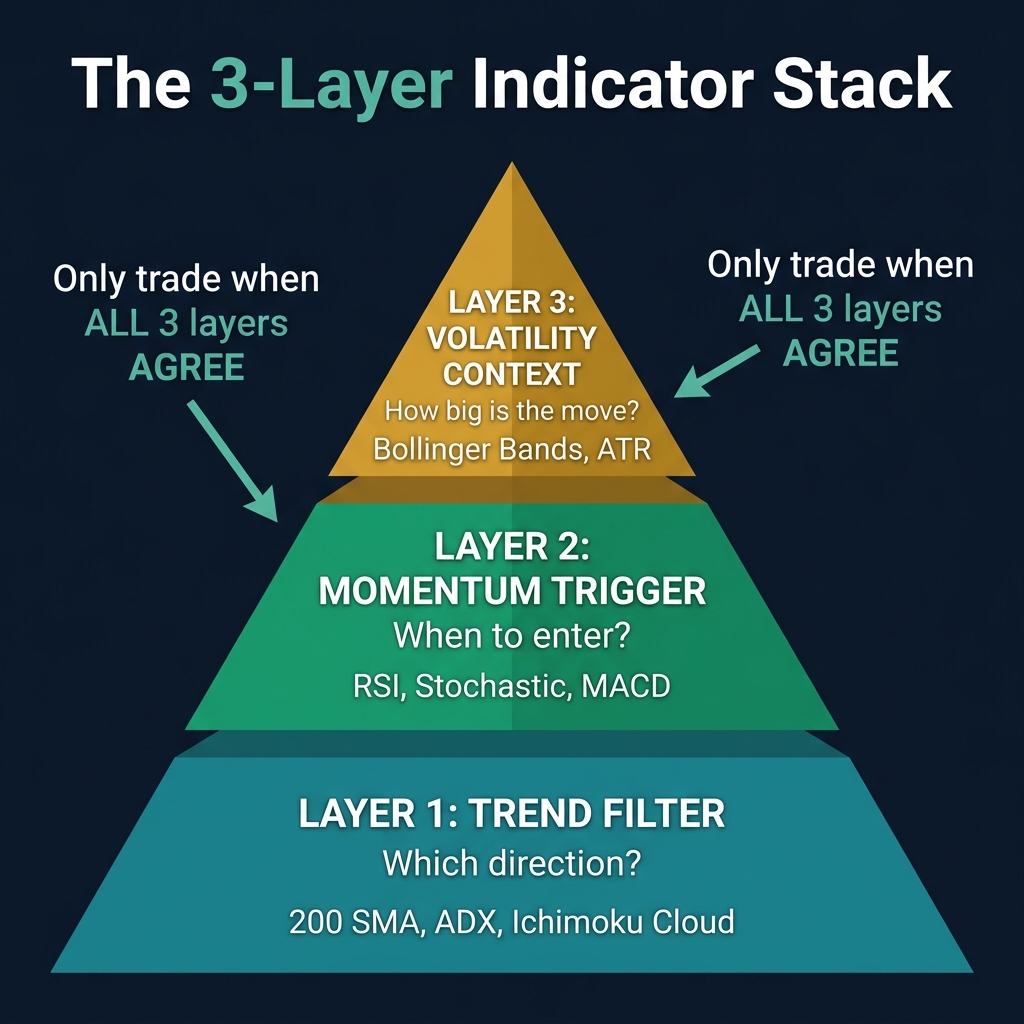
Every indicator stack has three layers. Each layer serves a specific purpose and uses a different type of indicator:
| Layer | Question It Answers | Best Indicators |
|---|---|---|
| 1. Trend Filter | Which direction should I trade? | 200 SMA, ADX, Ichimoku Cloud |
| 2. Momentum Trigger | When exactly should I enter? | RSI, Stochastic, MACD crossover |
| 3. Volatility Context | How big could the move be? | Bollinger Bands, ATR |
💡 Critical rule: Never use two indicators from the same category. Two momentum oscillators (e.g., RSI + Stochastic) will give you the same information twice — that's redundancy, not confirmation.
Layer 1: Trend Filter — "Which Direction?"
The trend filter is your compass. It tells you the overall direction and prevents you from trading against the market.
- 200 SMA: Price above = bullish bias, price below = bearish bias
- ADX: Above 25 = trending market (proceed with trend tools), below 20 = ranging (use oscillators instead)
- Ichimoku Cloud: Price above cloud = bullish, inside = no trade, below = bearish
Rule: the trend filter is your gate. If it says "bullish," you only look for buy setups. If it says "bearish," you only look for sell setups. No exceptions.
Layer 2: Momentum Trigger — "When to Enter?"
Once you know the direction, you need to find the optimal entry point. Momentum indicators help you time your entry with precision within the trend.
- RSI pullback: In an uptrend, buy when RSI dips to 40-50 and turns back up
- Stochastic crossover: Buy when %K crosses above %D in oversold zone (below 20)
- MACD crossover: Buy when MACD line crosses above signal line
Rule: the momentum trigger gives you the timing. Never enter just because the trend filter is bullish — wait for the momentum pullback to give you a better price.
Layer 3: Volatility Context — "How Big Is the Move?"
The volatility layer helps you set stop losses and profit targets based on how much the market is actually moving.
- Bollinger Bands: Narrow bands = low volatility (expect breakout). Wide bands = high volatility (expect mean reversion)
- ATR (Average True Range): Tells you the average pip movement — use it to set realistic stop-loss distances
Rule: volatility context prevents you from setting stops too tight (guaranteeing a stop-out) or profit targets too ambitious (never getting filled).
The Stack in Action
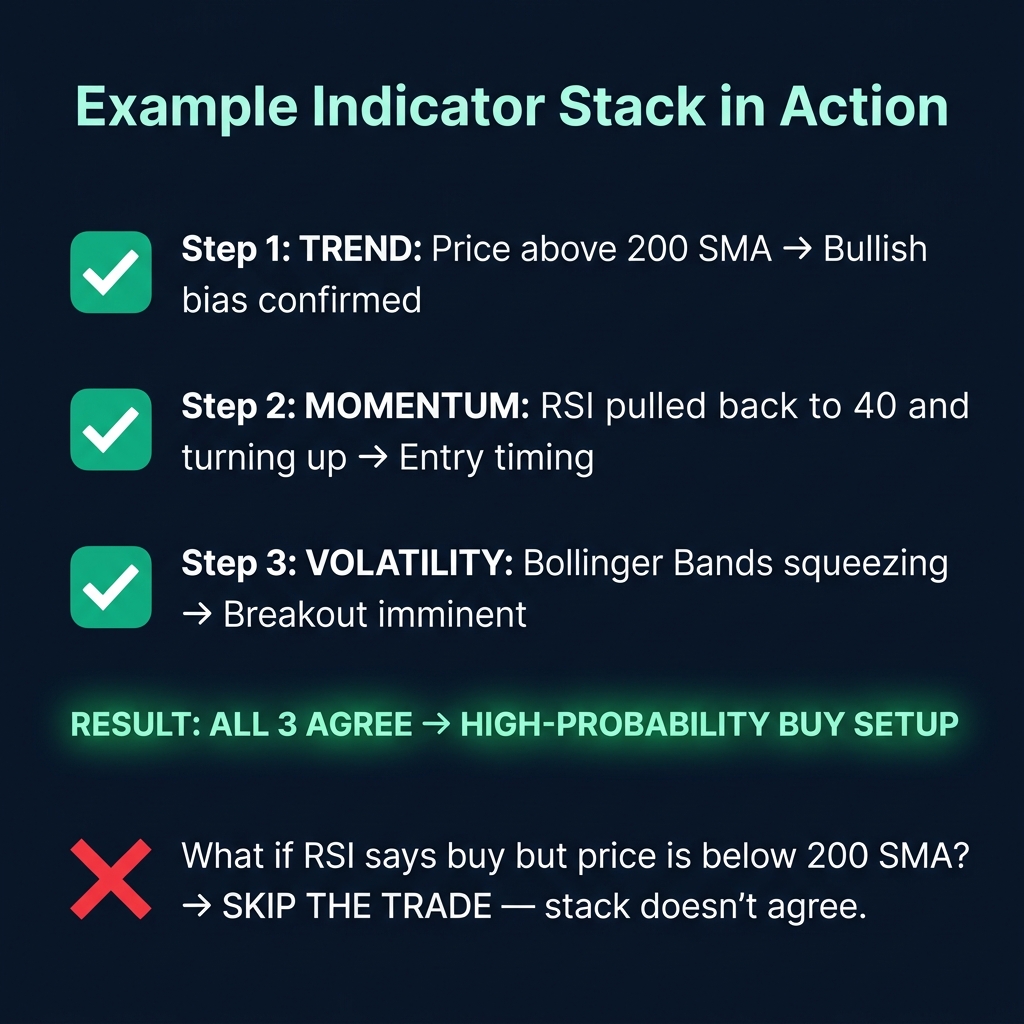
Example: Buy Setup Checklist
- ✅ Trend: Price above 200 SMA → bullish bias confirmed
- ✅ Momentum: RSI pulled back to 42 and is turning up → entry timing
- ✅ Volatility: Bollinger Bands squeezing → breakout imminent
- 🎯 Result: All 3 agree → high-probability buy setup
Example: Skip the Trade
- ✅ Momentum: RSI says oversold at 28 → looks like a buy
- ❌ Trend: Price below 200 SMA → bearish bias
- 🚫 Result: Stack doesn't agree → skip the trade
🎯 The power of the stack: It eliminates emotional decisions. You're not "feeling" bullish — your checklist either confirms or denies the trade. This discipline is what separates profitable traders from everyone else.
Pre-Built Stacks for Different Styles
| Trading Style | Trend Filter | Momentum | Volatility |
|---|---|---|---|
| Swing Trader | 200 SMA + ADX | RSI (14) | Bollinger Bands (20,2) |
| Day Trader | 50 EMA | Stochastic (14,3,3) | ATR (14) |
| Trend Follower | Ichimoku Cloud | MACD (12,26,9) | ADX |
Pick one stack and use it for at least 20 trades before switching. Consistency beats optimization.
Quick Recap
- ✅ An indicator stack combines 3 tools from 3 different categories
- ✅ Layer 1 (Trend) → direction. Layer 2 (Momentum) → timing. Layer 3 (Volatility) → context
- ✅ Never use two indicators from the same category — that's redundancy
- ✅ Trade only when all 3 layers agree — skip everything else
- ✅ Pick one stack, master it, then customize over time
🎯 Your Action Step
Choose one of the pre-built stacks above that matches your trading style. Set it up on your EUR/USD Daily chart. Now scan the chart — can you find a moment where all 3 layers aligned? That's your high-probability zone. Practice identifying these moments on historical data for 20 candles.