The Moment the Market Finally Moves
You've been watching EUR/USD bounce between 1.0850 and 1.0920 for two weeks. Every time it hits resistance, it drops. Every time it hits support, it bounces. Then one day, a massive bullish candle rips straight through 1.0920 and closes at 1.0960. The range is broken. The breakout is on.
Breakout trading is about catching these explosive moves when price escapes from consolidation zones. Done right, it delivers some of the best risk-reward ratios in trading. Done wrong, you'll get trapped in fakeouts and whipsawed into oblivion.
What Is a Breakout?
A breakout occurs when price moves decisively beyond a clearly defined support or resistance level — a level that previously held multiple times. The key word is "decisively." A wick poking above resistance and closing back below is NOT a breakout. It's a trap.
Breakouts happen at:
- Horizontal support/resistance — the most common and reliable
- Trendlines — price breaking a diagonal line of support/resistance
- Chart patterns — triangles, flags, head & shoulders necklines
- Round numbers — psychological levels like 1.1000, 150.00
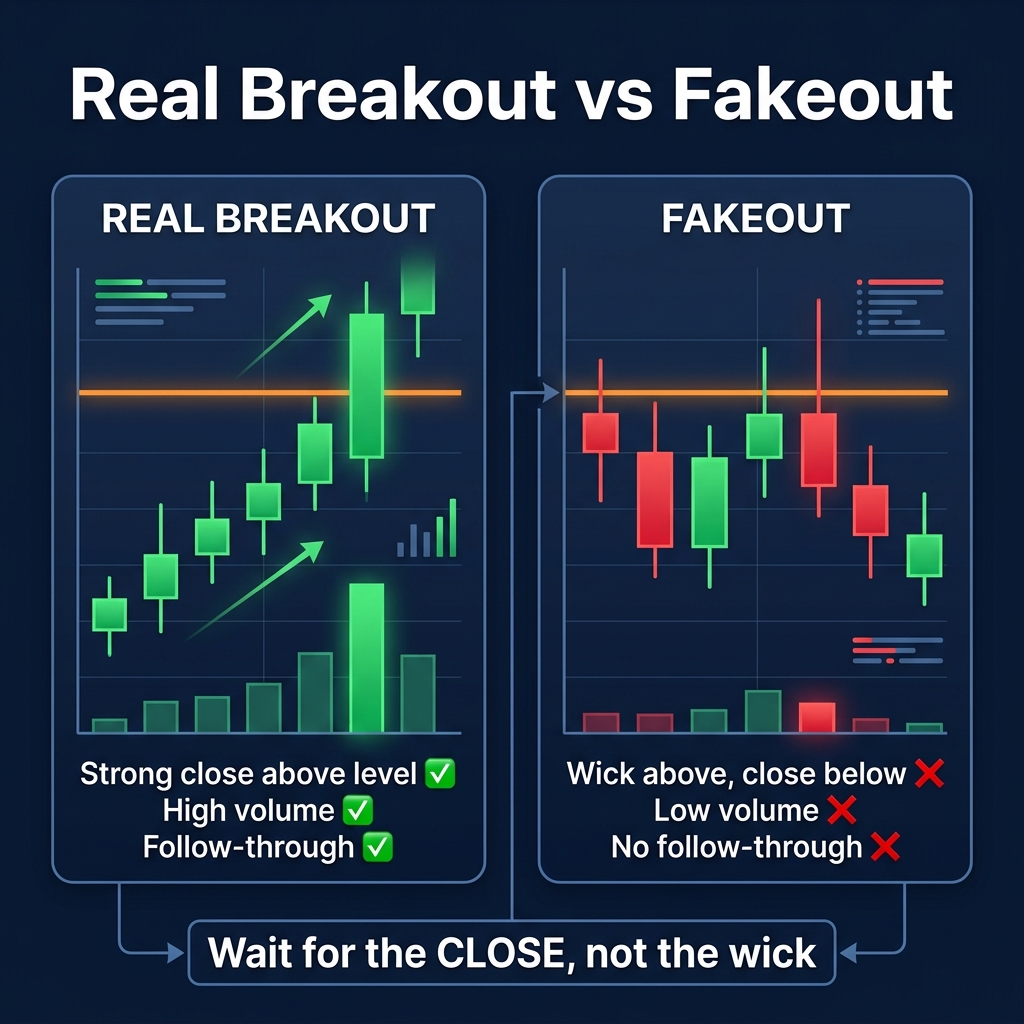
Real Breakout vs Fakeout — How to Tell the Difference
Here's the uncomfortable truth: most breakouts fail. Studies suggest that 60-70% of breakouts in forex result in fakeouts. So the skill isn't just spotting breakouts — it's filtering the real ones from the fakes.
| Factor | Real Breakout | Fakeout |
|---|---|---|
| Candle Close | Full body closes beyond the level | Only wick pokes through, body stays inside |
| Candle Size | Larger than average — strong momentum | Small, hesitant candle |
| Volume | Increasing volume on the breakout candle | Low or declining volume |
| Follow-through | Next 1-2 candles continue in breakout direction | Immediately reverses back inside range |
| Higher TF Trend | Breakout direction aligns with larger trend | Breakout fights the larger trend |
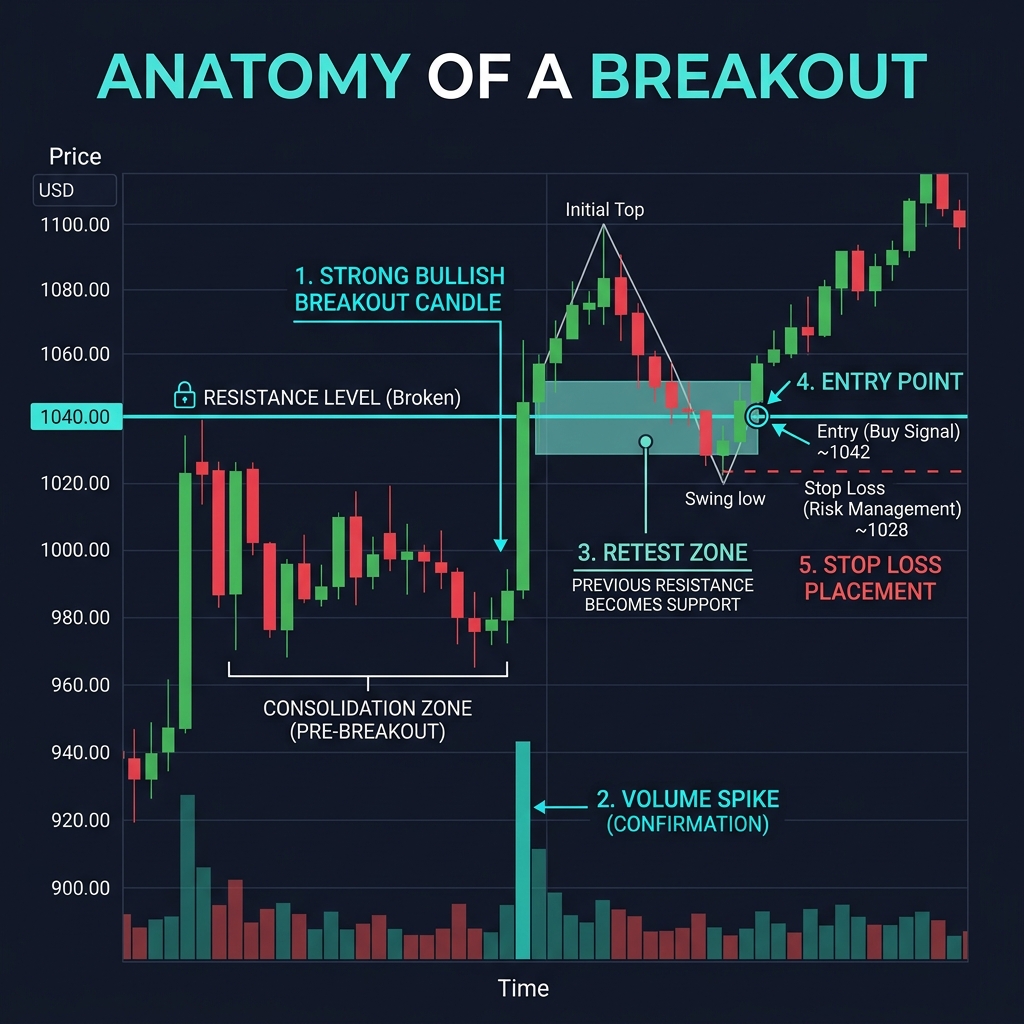
Two Breakout Entry Methods
Method 1: The Momentum Entry
Enter immediately after the breakout candle closes beyond the level. This catches the initial momentum but risks entering a fakeout.
- Entry: Close of the breakout candle
- Stop loss: Below the breakout level (or below the breakout candle's low)
- Best for: Strong, high-volume breakouts with clear trend alignment
Method 2: The Retest Entry (Safer)
Wait for price to break out, then pull back to retest the broken level. Old resistance becomes new support (or vice versa). Enter on the retest.
- Entry: When price retests the broken level and shows a rejection (pin bar, engulfing)
- Stop loss: Below the retest low
- Best for: Traders who want higher probability at the cost of sometimes missing the move
The retest method doesn't always happen — sometimes breakouts explode without looking back. But when it does occur, it's one of the highest-probability entry patterns in trading.
The Breakout Checklist
Before entering any breakout trade, run through this checklist:
- ✅ Clear level with multiple touches — at least 2-3 tests of the level
- ✅ Strong candle close beyond the level — not just a wick
- ✅ Above-average volume — smart money participates in real breakouts
- ✅ Higher timeframe alignment — breakout direction matches the larger trend
- ✅ No major news in next 30 minutes — news can reverse breakouts instantly
Score: 4-5 = Take the trade. 3 = Reduced size. Below 3 = Skip.
Complete Trade Example
Bullish breakout on USD/CAD H4:
- Resistance at 1.3650 tested 4 times over 10 days
- ADX rising from 18 to 28 during consolidation (building pressure)
- Strong bullish marubozu closes at 1.3685 with 2x average volume
- Higher TF (Daily) in uptrend, 50 EMA sloping up ✅
- Checklist: 5/5 — high conviction
- Entry: 1.3688 | Stop: 1.3640 (48 pips) | Target: 1.3780 (92 pips)
- R:R = 1:1.9
- Price reached 1.3810 in 3 sessions ✅
Quick Recap
- Breakouts occur when price closes decisively beyond a well-tested level
- 60-70% of breakouts fail — use the fakeout filter checklist
- Two entry methods: momentum entry (immediate) or retest entry (safer)
- Real breakouts have: strong close, high volume, follow-through, and higher TF alignment
- Always define your stop loss based on the breakout structure, not fixed pips
🎯 Your Action Step
Find a current consolidation zone on EUR/USD or GBP/USD (H4 or Daily). Mark the clear support and resistance levels. Set a price alert at both boundaries. When a breakout candle closes beyond one of those levels, run through the 5-point breakout checklist and decide: is this a real breakout or a fakeout? Don't trade it for real — just practice the decision-making process.