The Indicator That Measures Market Emotion
Created by John Bollinger in the 1980s, Bollinger Bands do something no other indicator does: they measure volatility — how much the market is expanding or contracting. When the bands are wide, the market is volatile. When they squeeze together, something big is about to happen.
Think of Bollinger Bands as a rubber band around price. Stretch it too far, and it snaps back. Squeeze it too tight, and it explodes in one direction.
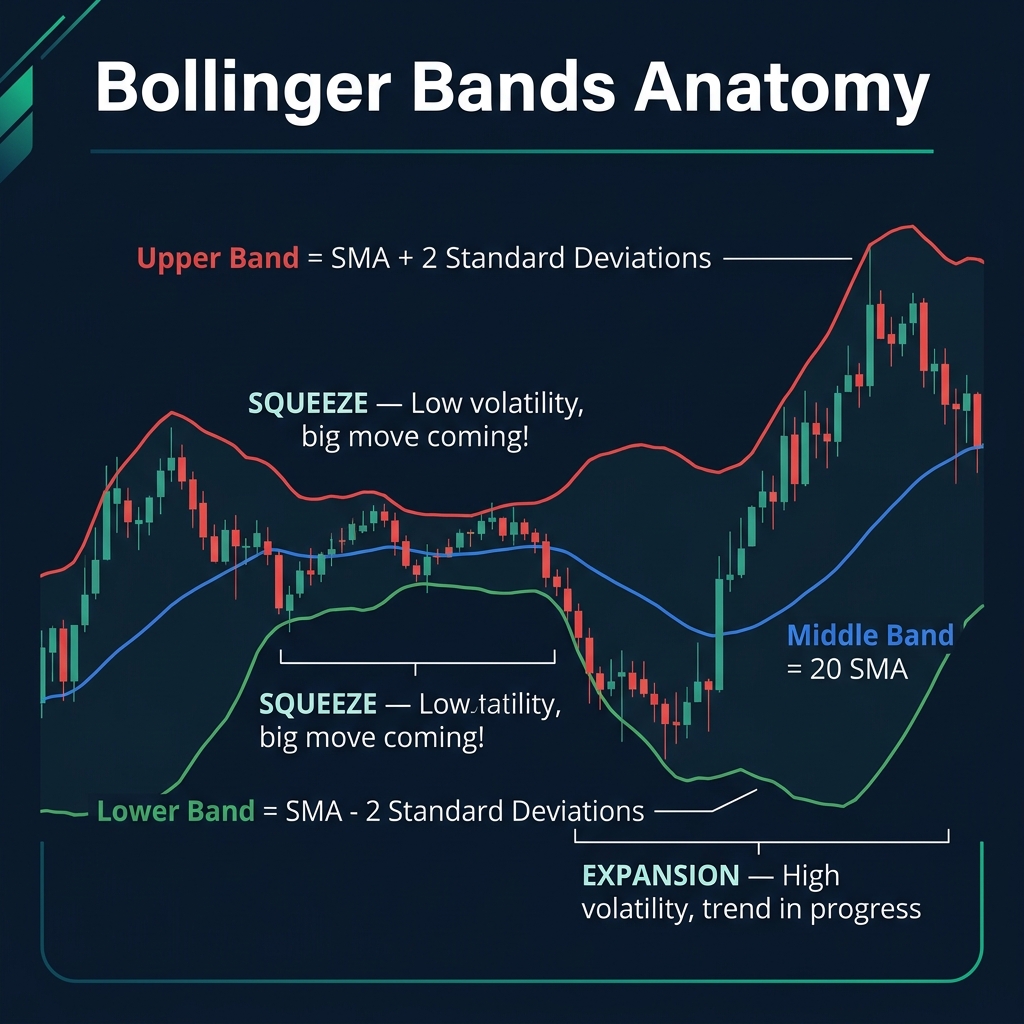
Anatomy of Bollinger Bands
| Component | Formula | What It Shows |
|---|---|---|
| Upper Band | 20 SMA + 2 Standard Deviations | Dynamic overbought level — price is relatively expensive |
| Middle Band | 20 SMA (Simple Moving Average) | The trend — acts as dynamic S&R |
| Lower Band | 20 SMA - 2 Standard Deviations | Dynamic oversold level — price is relatively cheap |
Statistically, 95% of price action stays within the bands. When price touches or breaks a band, it's an extreme move.
Two Core Strategies
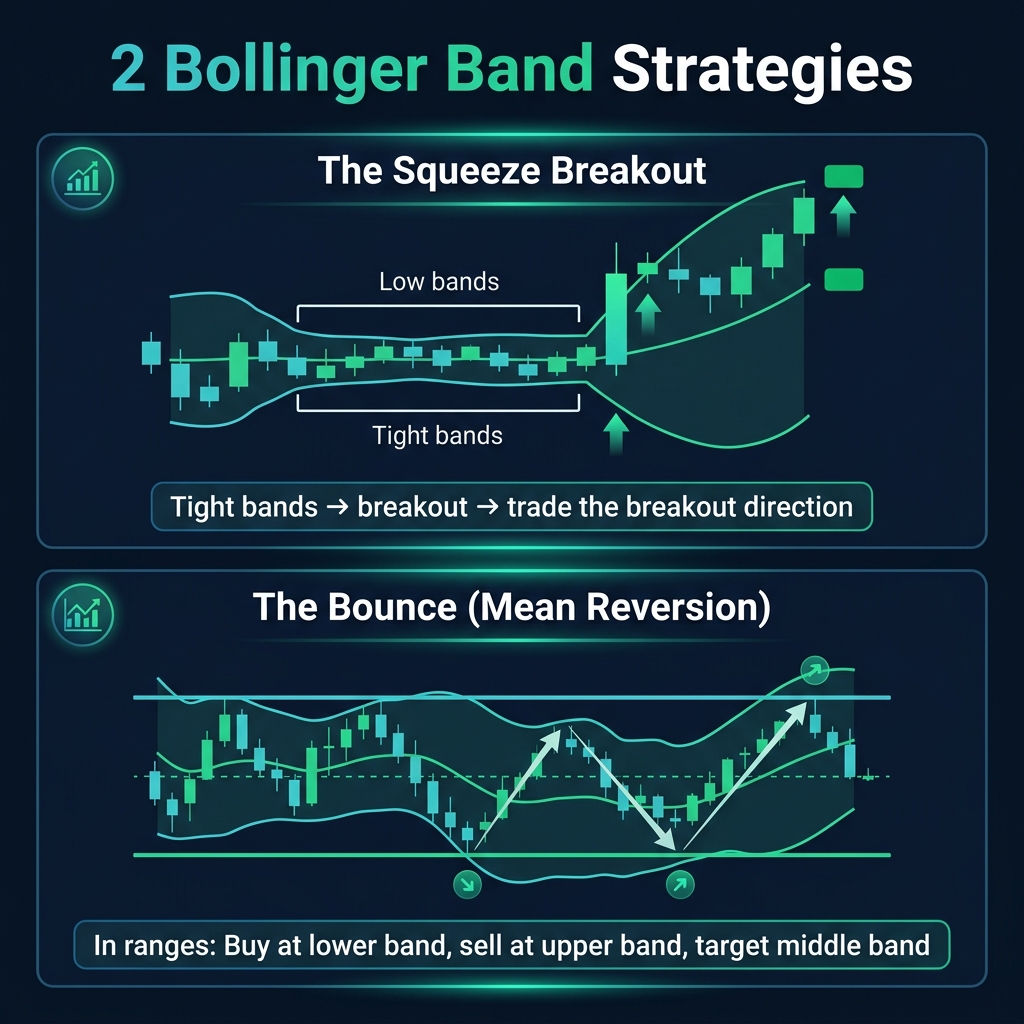
Strategy 1: The Squeeze Breakout
When the bands squeeze together (become very narrow), volatility is low. The market is consolidating like a spring being compressed. A breakout is imminent.
- Identify the squeeze — bands are the narrowest they've been in weeks
- Wait for price to break above the upper band (bullish) or below the lower band (bearish)
- Enter in the breakout direction with a candlestick confirmation
- Stop loss: on the opposite side of the squeeze area
Strategy 2: The Bounce (Mean Reversion)
In ranging markets, price tends to bounce between the upper and lower bands.
- Price touches the lower band → look for bullish candle → buy
- Price touches the upper band → look for bearish candle → sell
- Target: the middle band (20 SMA) as your take-profit
⚠️ Warning: In a strong trend, price can "ride the band" — touching the upper band repeatedly without reversing. The bounce strategy ONLY works in ranging markets.
Quick Recap
- ✅ Bollinger Bands measure volatility — wide = volatile, narrow = calm
- ✅ Three components: Upper Band, Middle Band (20 SMA), Lower Band
- ✅ Squeeze = breakout coming. Trade the direction of the breakout
- ✅ Bounce = mean reversion. Buy at lower band, sell at upper band (ranges only)
- ✅ 95% of price stays within the bands — touches are extreme events
🎯 Your Action Step
Add Bollinger Bands (20, 2) to USD/JPY on the H4 chart. Find a squeeze in the last month. Which direction did the breakout go? How far did price travel? Then find a ranging period where price bounced between bands. This teaches you both strategies in action.