When Buyers Run Out of Fuel — The Seller's Takeover
Just as bullish patterns signal buying opportunities, bearish reversal patterns warn you that an uptrend is losing steam. These candle formations appear at the top of an uptrend and tell you: sellers are about to take control.
Learning to read bearish signals is just as important as reading bullish ones — because knowing when NOT to buy (or when to sell) protects your profits and prevents you from buying at the top.
In this lesson, you'll learn the three most reliable bearish reversal patterns: the Shooting Star, the Evening Star, and the Dark Cloud Cover.
The 3 Bearish Reversal Patterns
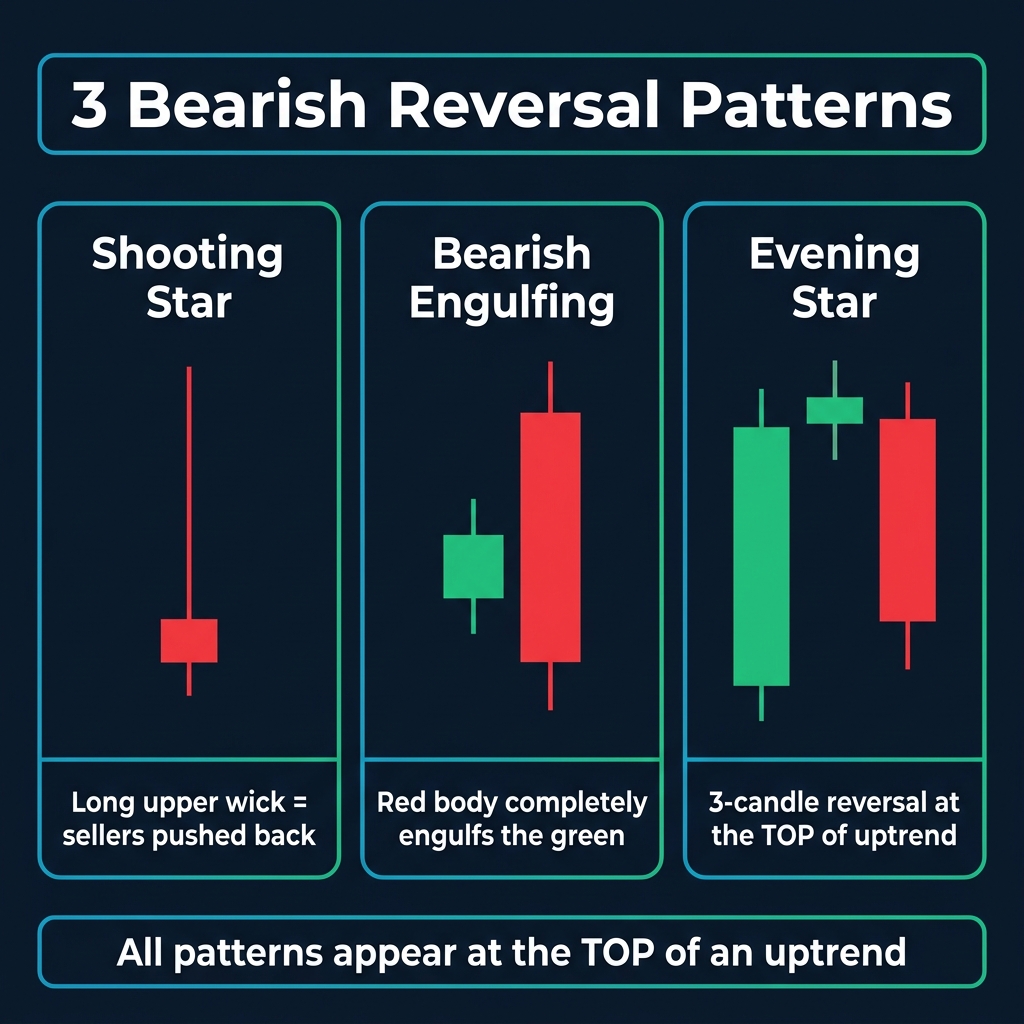
1. The Shooting Star
The mirror image of the hammer. A single-candle pattern at the top of an uptrend with a long upper wick and small body at the bottom.
| Feature | What to Look For |
|---|---|
| Body | Small, positioned at the bottom of the candle |
| Upper wick | At least 2x the length of the body |
| Lower wick | Little to none |
| Color | Red is stronger, but green shooting stars still valid |
| Location | Must appear after an uptrend |
What it tells you: Buyers pushed price up aggressively during the session. But sellers stepped in and forced the price back down — almost to the open. The long upper wick = seller rejection of higher prices.
2. Evening Star
The opposite of the morning star — a three-candle pattern at the top of an uptrend:
- Long green candle — Uptrend continues, buyers in control
- Small body candle (doji or spinning top) — Momentum stalls. Indecision
- Long red candle — Sellers take over. The reversal begins
What it tells you: The story shifts from certainty (buyers winning) → doubt (indecision) → new direction (sellers winning). The evening star is one of the most reliable bearish reversal signals.
3. Dark Cloud Cover
A two-candle pattern where:
- Candle 1: Strong green candle — the uptrend looks healthy
- Candle 2: Red candle that opens above the previous high but closes below the midpoint of the green candle
What it tells you: Despite opening with a gap up (bullish start), sellers overwhelmed buyers and pushed price well below the midpoint of the previous session. The "dark cloud" is covering the bullish sky.
💡 Remember: For a valid dark cloud cover, the red candle must close below the 50% midpoint of the previous green candle. If it closes above that midpoint, the signal is weak.
Context Is Everything — Resistance + Bearish Pattern
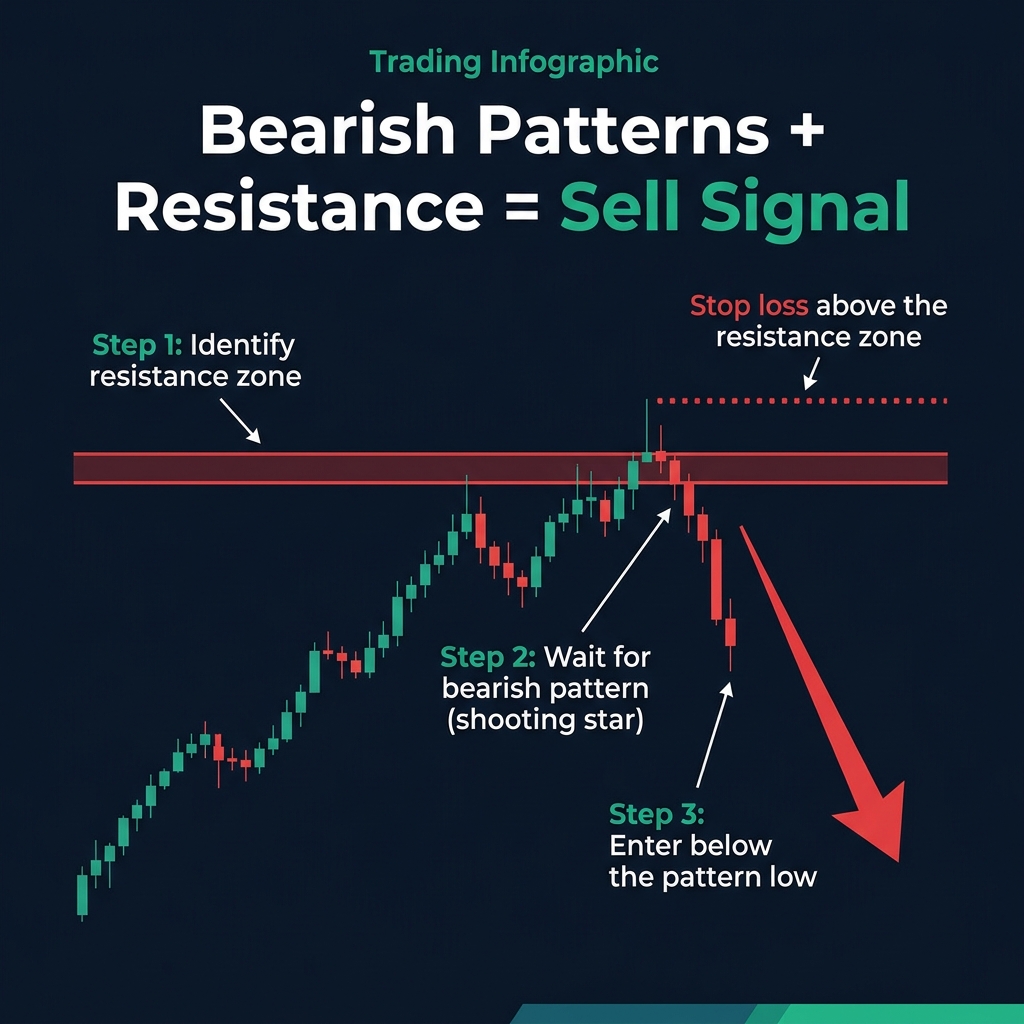
Just like bullish patterns, bearish patterns only matter at the right location:
- ✅ At a resistance zone
- ✅ At a downtrend line (dynamic resistance)
- ✅ At a psychological level (like 1.1100 or 1.1200)
- ✅ At a previous support turned resistance (polarity)
A shooting star in the middle of nowhere = noise. A shooting star at resistance = trade setup.
🎯 The formula: KEY RESISTANCE + BEARISH PATTERN + CONFIRMATION = Sell signal
Bullish vs Bearish — The Complete Mirror
| Bullish Pattern | Bearish Mirror | Candles |
|---|---|---|
| Hammer | Shooting Star | 1 |
| Bullish Engulfing | Bearish Engulfing | 2 |
| Morning Star | Evening Star | 3 |
| Piercing Line | Dark Cloud Cover | 2 |
Every bullish pattern has a bearish counterpart. Once you learn one side, you automatically know the other.
Quick Recap
- ✅ Shooting Star = single candle, long upper wick, at the top of an uptrend
- ✅ Evening Star = 3 candles: green → indecision → red (strongest sell signal)
- ✅ Dark Cloud Cover = red candle closes below 50% of previous green candle
- ✅ Location matters most — only trade these at key resistance levels
- ✅ Every bullish pattern has a bearish mirror
🎯 Your Action Step
On GBP/USD Daily chart, find 3 examples of bearish reversal patterns that appeared at resistance levels. Compare: which patterns led to the biggest drops? You'll find that patterns at key levels are far more reliable than those in the middle of the chart.