Trust But Verify — How to Know If Your Edge Is Real
You've built your system. It looks great on paper. But does it actually work? Backtesting answers this question with data, not hope. It's the process of applying your trading rules to historical data to see how they would have performed in the past.
Backtesting won't guarantee future results — but it will tell you if your system has ever worked at all. If it can't make money on historical data, it definitely won't make money live.
What Is Backtesting?
Backtesting means going through past price data and applying your entry rules, exit rules, and risk management exactly as written — then recording every trade as if you had taken it live.
What Backtesting Tells You
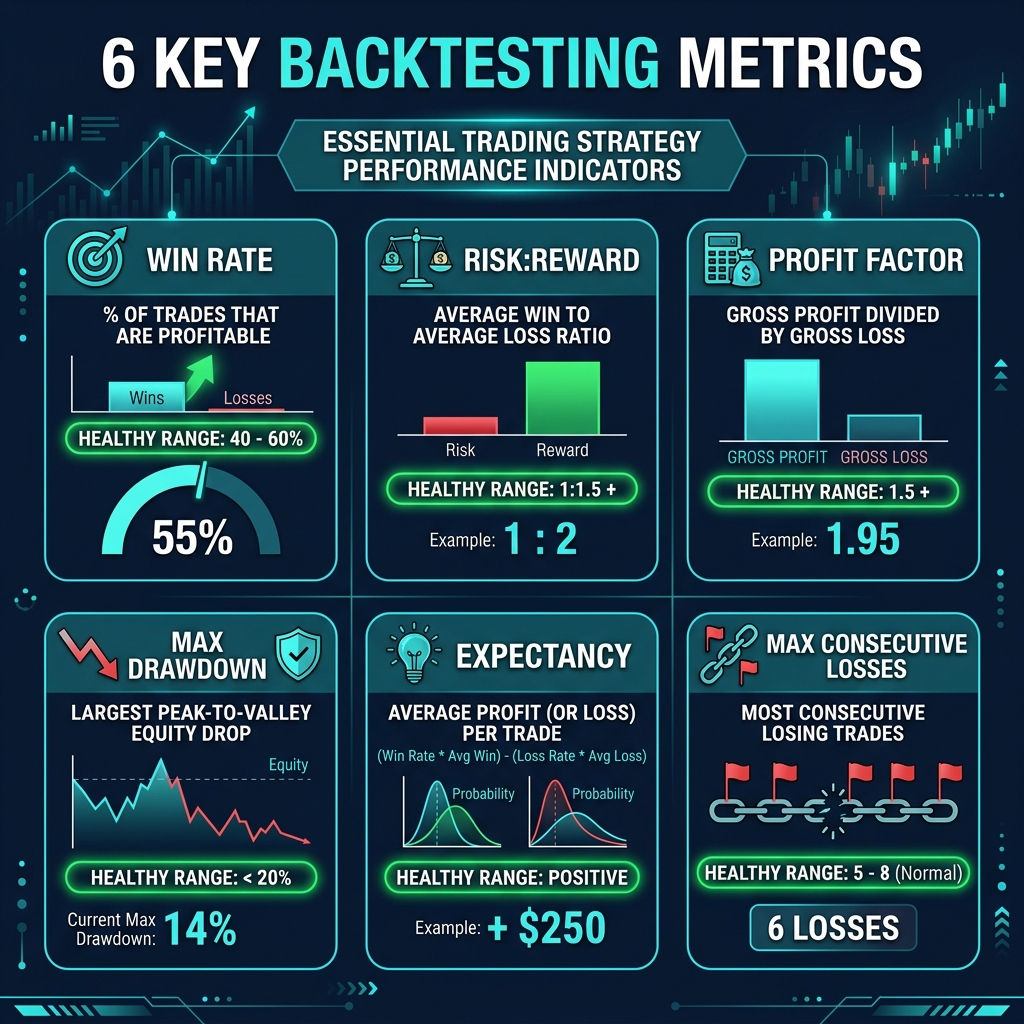
| Metric | What It Reveals | Healthy Range |
|---|---|---|
| Win Rate | % of trades that are profitable | 40-60% (with good R:R, even 40% is profitable) |
| Risk:Reward Ratio | Average win size vs average loss size | 1:1.5 or better |
| Profit Factor | Total wins ÷ Total losses | Above 1.5 (2.0+ is excellent) |
| Max Drawdown | Largest peak-to-trough decline | Under 15-20% of account |
| Expectancy | Average $ won per trade | Positive (any positive number means the system makes money) |
| Max Consecutive Losses | Longest losing streak | 5-8 is normal for a 50% win rate system |
How to Backtest — The Manual Method
Manual backtesting is the best way for new system builders because you experience every trade mentally. It builds the intuition you need for live trading.
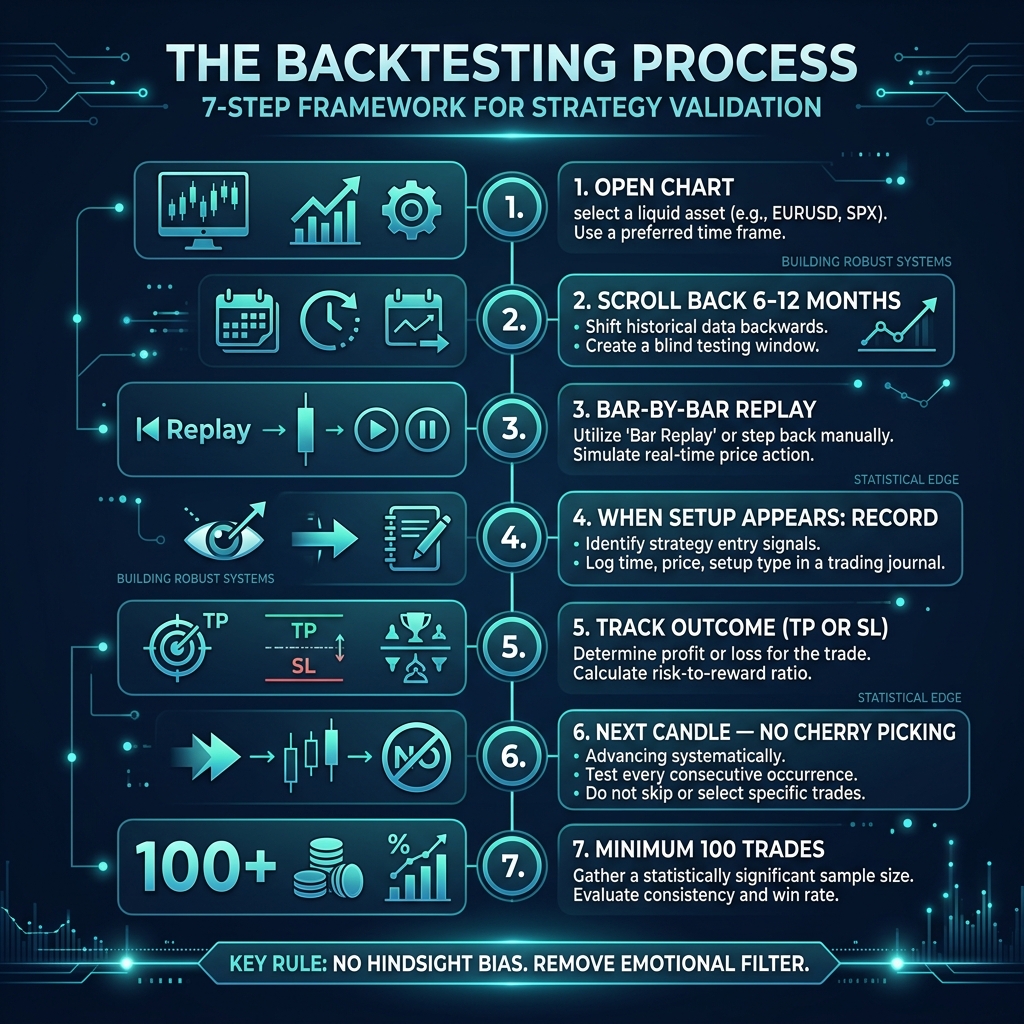
Step-by-Step Process
- Open TradingView or MT4/MT5 on your analysis timeframe
- Scroll back 6-12 months on your chosen pair
- Bar-by-bar replay: Move through each candle and apply your entry rules
- When your setup appears: Record it — entry price, SL, TP1, TP2
- Track the outcome: Did it hit TP or SL? Record the result
- Move to the next candle — no cherry-picking, no skipping
- Minimum 100 trades for statistically meaningful results
The Backtest Spreadsheet
Keep a simple spreadsheet with these columns:
| Date | Pair | Direction | Entry | SL | TP | Result (W/L) | R:R | Notes |
|---|---|---|---|---|---|---|---|---|
| 2025-01-15 | EUR/USD | Long | 1.0850 | 1.0820 | 1.0910 | W | 1:2 | Clean S/R bounce |
| 2025-01-18 | EUR/USD | Short | 1.0920 | 1.0950 | 1.0860 | L | -1 | Against trend |
The Golden Rules of Backtesting
- No hindsight bias: Only trade setups as they would have appeared in real-time. Don't use the right edge of the chart to "validate" your entry.
- 100-trade minimum: Anything less is statistically meaningless. You need enough data to see true patterns.
- Multiple market conditions: Backtest through trending AND ranging markets. A system that only works in trends is not a system — it's a lucky streak.
- Record EVERY setup: Including the ones you skip. This reveals filtering biases.
- Be brutally honest: If you wouldn't have taken the trade in real-time, don't count it as a win.
Interpreting Your Results
| Result | What It Means | Action |
|---|---|---|
| Win rate 55%+ with 1:1.5+ R:R | Strong edge — ready for forward testing | Move to forward testing on demo |
| Win rate 45-55% with 1:2+ R:R | Good edge — low win rate offset by big winners | Move to forward testing — manage psychology |
| Win rate below 40% with any R:R | Weak edge — needs refinement | Review entry filters, add confluence |
| Profit factor below 1.0 | System loses money — doesn't work | Major overhaul or start over |
| Max drawdown over 25% | Too much risk — position sizing issue | Reduce risk per trade, add drawdown rules |
Quick Recap
- Backtesting = applying your rules to historical data to measure performance
- Track 6 key metrics: win rate, R:R, profit factor, max drawdown, expectancy, max consecutive losses
- Manual backtesting builds both data and intuition
- You need minimum 100 trades across different market conditions
- Be honest — no hindsight bias, no cherry-picking
- If your backtest is profitable, move to forward testing. If not, refine and retest.
🎯 Your Action Step
Take the one-page system you built in the last lesson. Open TradingView and scroll EUR/USD back 6 months. Manually step through the chart and log the first 20 trades using your entry and exit rules. Use the spreadsheet template above. Don't worry about perfection — this is your first backtest. What matters is building the habit of testing before trading.