The Indicators That Complete Your Toolkit
You've now learned the major indicators — RSI, MACD, Stochastic, Bollinger Bands, and Ichimoku. But there are three more tools that play critical supporting roles in a professional trader's toolkit. They won't generate trade signals on their own, but they answer questions that other indicators can't.
ADX tells you how strong the trend is. CCI identifies extreme price deviations. Parabolic SAR provides a built-in trailing stop. Together with the main indicators, they complete your technical analysis arsenal.
The Supporting Cast
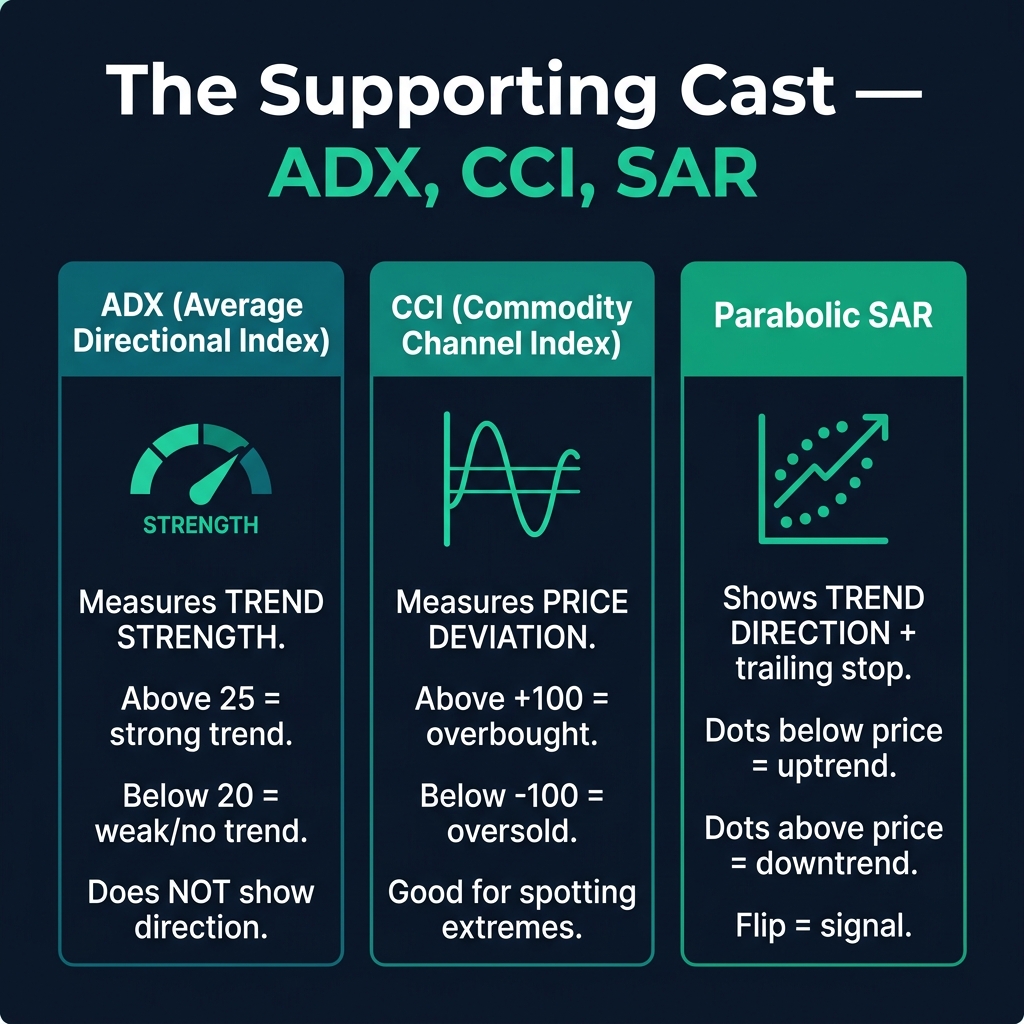
ADX (Average Directional Index)
The ADX measures trend strength on a scale from 0 to 100. Crucially, it does NOT tell you the direction — only how strong or weak the current trend is.
| ADX Reading | What It Means | Action |
|---|---|---|
| 0-20 | No trend / Very weak | Use range-trading strategies (Bollinger bounce, oscillators) |
| 20-25 | Trend emerging | Prepare — a trend may be starting |
| 25-50 | Strong trend | Trade with the trend (MA, breakouts) |
| 50-75 | Very strong trend | Stay in the trade — don't fight it |
| 75-100 | Extreme trend (rare) | Be cautious — the trend may be exhausting |
💡 Use ADX to decide WHICH strategy to use: ADX above 25 → trend-following (MAs, breakouts). ADX below 20 → mean-reversion (Bollinger, oscillators).
CCI (Commodity Channel Index)
Despite its name, CCI works on any market — not just commodities. It measures how far the current price has deviated from its statistical mean.
- Above +100: Price is significantly above average — overbought territory
- Below -100: Price is significantly below average — oversold territory
- Between -100 and +100: Normal price range
CCI is particularly useful for:
- Spotting extreme price deviations that may snap back
- Divergence analysis (like RSI divergence, but with CCI)
- Confirming trend strength — readings staying above +100 indicate a strong bullish trend
Parabolic SAR (Stop and Reverse)
Parabolic SAR places dots above or below price to indicate trend direction. When the dots flip, the trend has reversed.
- Dots BELOW price → uptrend (price is rising)
- Dots ABOVE price → downtrend (price is falling)
- Dot flip → potential trend reversal — the signal to exit or reverse your trade
SAR is most useful as a trailing stop-loss:
- Enter a trade using your primary strategy (S&R, Fibonacci, etc.)
- Place your stop loss at the current SAR dot level
- As the dots move in your favor, trail your stop to each new dot
- When the dots flip, exit the trade
The Indicator Pyramid — Building Your Toolkit
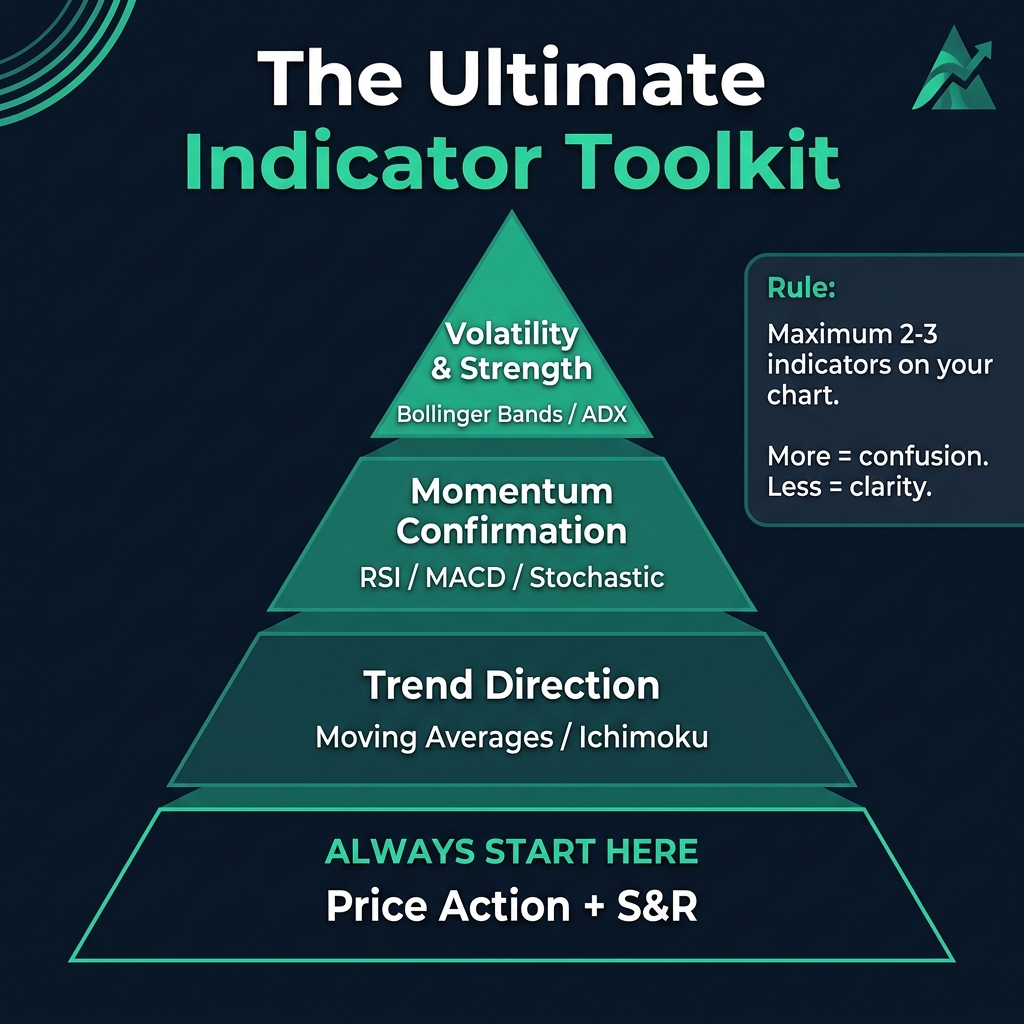
With all the tools you've learned in Level 5, here's how to organize them:
| Layer | Purpose | Tools |
|---|---|---|
| Foundation | Where to trade | Price Action, S&R, Fibonacci |
| Trend | Which direction | Moving Averages, Ichimoku Cloud |
| Momentum | When to enter | RSI, MACD, Stochastic |
| Volatility | How big the move | Bollinger Bands, ADX |
🎯 The golden rule: Never use more than 2-3 indicators at the same time. Pick one from each category that suits your style. Too many indicators = conflicting signals = paralysis.
Quick Recap
- ✅ ADX measures trend strength (not direction) — above 25 = trending, below 20 = ranging
- ✅ CCI measures price deviation — above +100 or below -100 = extreme
- ✅ Parabolic SAR shows trend direction with dots and works as a trailing stop
- ✅ Max 2-3 indicators on your chart — pick one from each category
- ✅ Foundation is always price action — indicators confirm, they don't replace
🎯 Your Action Step
Add ADX (14) and Parabolic SAR to your EUR/USD Daily chart. Check the ADX reading — is the market trending (above 25) or ranging (below 20)? Look at the SAR dots — which direction is the trend? Now ask: does this align with what price action and your S&R levels tell you? When all tools agree, you have a high-probability setup.
Level 5 complete! → Take the Essential Indicators quiz to test your knowledge and earn your Technical Tools certificate.